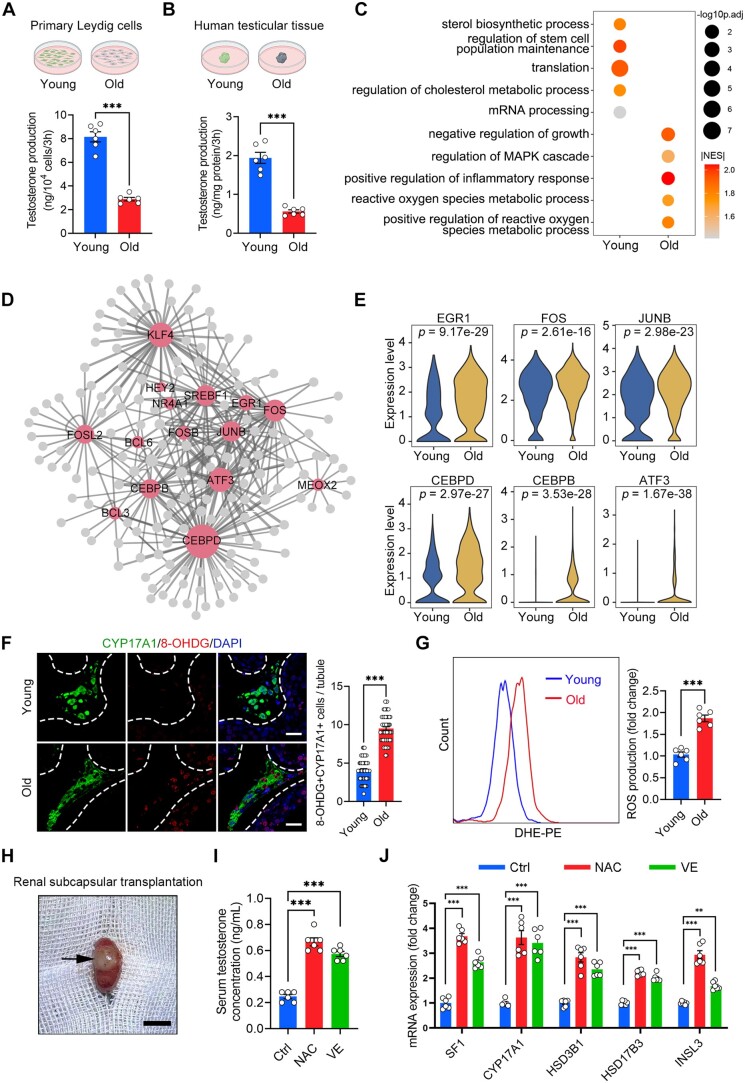
Figure 5.
Dysfunction of Leydig cells during human testicular ageing. (A, B) Quantification of testosterone production in primary LCs (A) and human testicular tissue (B). Young, n = 6 samples; Old, n = 6 samples. Data are expressed as mean ± SEM. Significance was determined by Student’s t-test. ***P < 0.001. (C) Representative GO terms of DEGs in old and young human LCs. Dot size indicates the range of −log10(adjusted P-value). Colour keys, ranging from grey to orange to red, indicate the absolute values of the NES. (D) Network visualization of potential key transcriptional regulators of upregulated DEGs in LCs. Node size is positively correlated with the number of directed edges. Edge width is positively correlated with the NES. Transcription factors are highlighted in red; others are highlighted in grey. (E) Violin plot showing the expression levels of age-associated upregulated transcriptional factors. Wilcoxon rank sum test was used; P-value is indicated. (F) Immunostaining and quantification of 8-OHDG and CYP17A1 in young and old human testis sections. Left, representative image of 8-OHDG and CYP17A1 in human testis sections. Right, quantification of the proportion of 8-OHDG+ LCs (CYP17A1+). Scale bars, 25 μm. Bars represent the mean with SEM of 60 independent tubules per group (Young, n = 10 samples; Old, n = 10 samples). Significance was determined by Student’s t-test. ***P < 0.001. (G) Quantification of ROS production in young and old primary LCs, as measured by flow cytometry. Young, n = 6 samples; Old, n = 6 samples. Data are expressed as mean±SEM. Significance was determined by Student’s t-test. ***P < 0.001. (H) Representative image of renal subcapsular transplantation with human testicular tissue. Arrows in the figure indicate the grafts. Scale bars, 1 cm. (I) Quantification of serum testosterone levels in Ctrl and antioxidant-treated (NAC and VE) groups. Ctrl, n = 6 samples; NAC (300 mg/kg), n = 6 samples; VE (100 mg/kg), n = 6 samples. Data are expressed as mean±SEM. Significance was determined by one-way ANOVA. ***P < 0.001. (J) Quantification of expression of steroidogenesis-related genes in the Ctrl and antioxidant-treated (NAC and VE) groups. Ctrl, n = 6 samples; NAC (300 mg/kg), n = 6 samples; VE (100 mg/kg), n = 6 samples. Data are expressed as mean±SEM. Significance was determined by one-way ANOVA. ***P < 0.001. GO, gene ontology; DEGs, differentially expressed genes; NES, normalized enrichment score; LCs, Leydig cells; ROS, reactive oxygen species; DHE-PE, Dihydroethidium-phycoerythrin; Ctrl, control group; NAC, N-acetylcysteine group; VE, vitamin E group.

