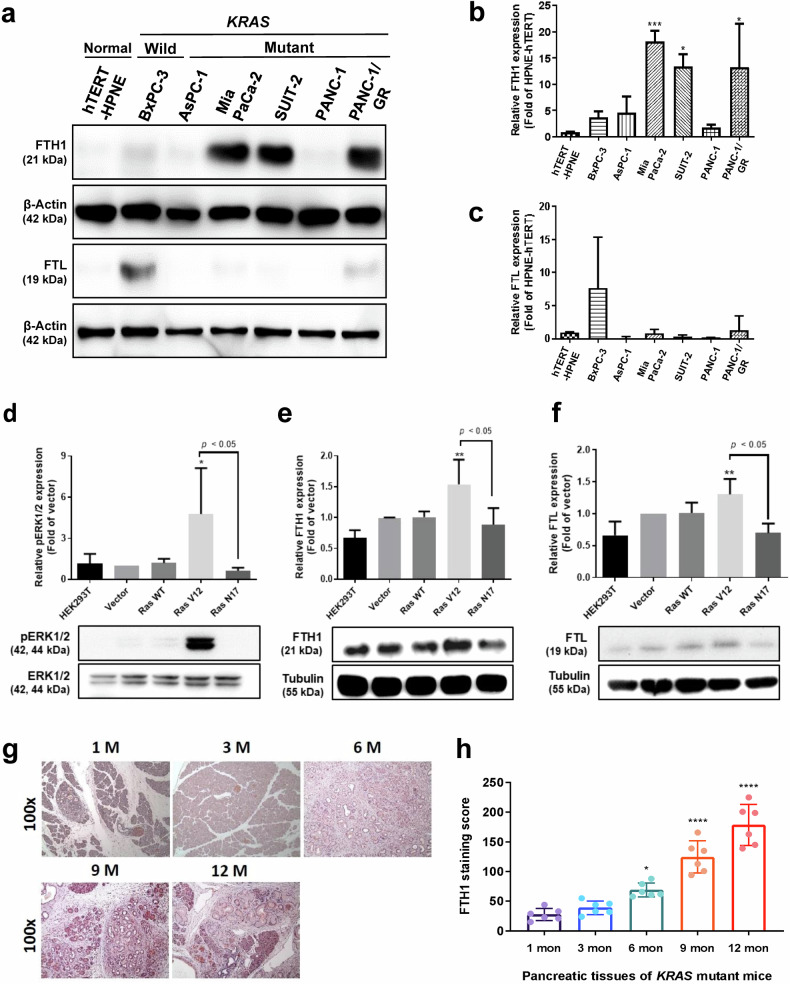
Fig. 2. Mutant KRAS regulates FTH1 expression in pancreatic cancer.
a Representative Western blot for FTH1 and FTL in hTERT-HPNE, BxPC-3, and KRAS-mutant pancreatic cancer (AsPC-1, Mia PaCa-2, SUIT-2, PANC-1, and PANC-1/GR) cells. β-Actin was used as a loading control. b, c show quantification of FTH1 and FTL expression in the indicated cells via ImageJ, normalized to β-actin, with bars indicating the mean fold change relative to hTERT-HPNE cell expression. The data are expressed as the means ± SDs (n = 3). *p < 0.05 and ***p < 0.001 compared with hTERT-HPNE cells. d–f HEK293T cells were transiently transfected with plasmids encoding vector, wild-type (WT), V12, or N17 plasmids and probed with d pERK1/2 and ERK1/2, e FTH1, and f FTL. Tubulin was used as a loading control. The data are expressed as the means ± SDs (n = 3). *p < 0.05 and **p < 0.01 compared with RAS V17 cells. g Representative images of FTH1 protein expression during pancreatic cancer development and progression in our KC mouse model. After tamoxifen administration, KC mice developed acinar-to-ductal metaplasia and PanIN. The mice were sacrificed during the indicated months, and their tissues were immunohistochemically stained for FTH1 (magnification, ×100). h IHC staining score for FTH1. The data are expressed as the means ± SDs (n = 6). *p < 0.05 and ****p < 0.0001.

