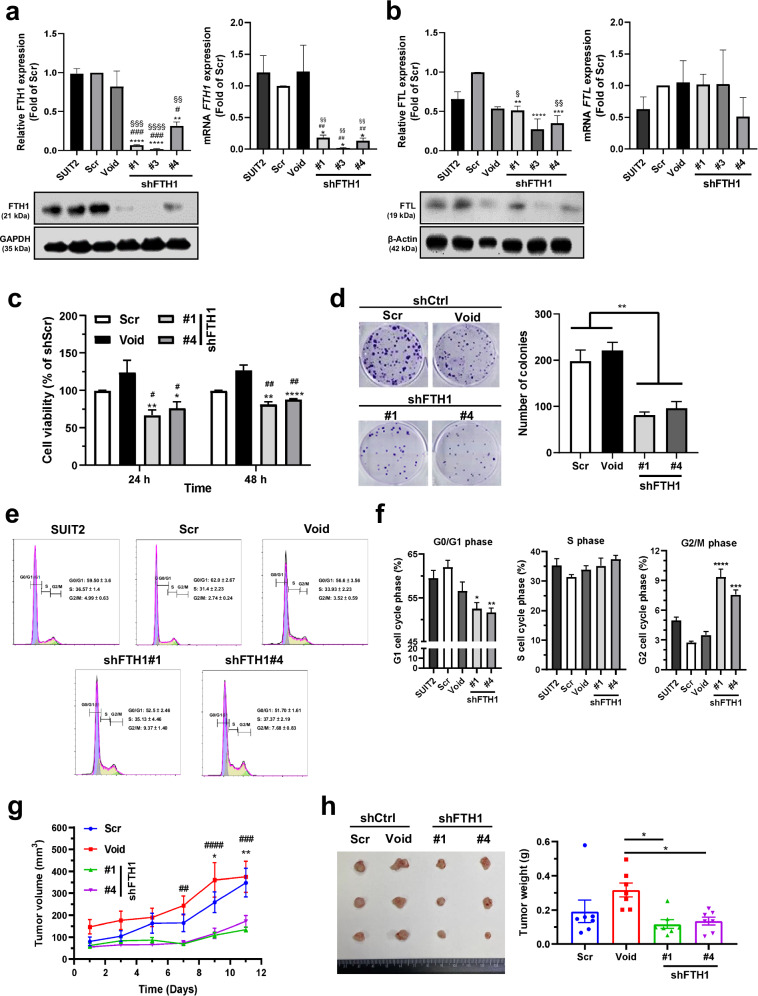
Fig. 3. FTH1 knockdown reduces KRAS-mutant pancreatic cancer cell viability and tumor growth.
a, b FTH1 was knocked down in KRAS-mutant SUIT-2 cells through stable expression of shRNAs against FTH1 via the lentiviral expression constructs shCtrl (Scr, Void) and shFTH1 (#1, #3, and #4). Western blot (left) and qRT‒PCR (right) analyses of FTH1 and FTL after shFTH1 plasmid transfection into SUIT-2 cells. GAPDH or β-actin was used as a loading control. *p < 0.05, **p < 0.01, ***p < 0.001, and ****p < 0.0001 compared with Scr; #p < 0.05, ##p < 0.01, and ###p < 0.001 compared with Void; and §p < 0.05, §§p < 0.01, §§§p < 0.001, and §§§§p < 0.0001 compared with SUIT-2 cells. c Cell viability in each cell group was determined using an MTT assay after 24 and 48 h. *p < 0.05 and **p < 0.01 compared with the Scr group; #p < 0.05 and ##p < 0.01 compared with the Void group. d Each group of cells was plated in triplicate in 6-well plates at 200 cells per well. After 8 days, colonies were counted using ImageJ after staining with 0.5% crystal violet in methanol. **p < 0.01 compared with the control (Scr and Void) group. e Cell cycle analysis through PI staining following flow cytometry of the transfected shCtrl (Scr or Void)-infected or shFTH1-infected SUIT-2 cells (#1 and #4). f G0/G1, S, and G2/M phase percentages of the indicated SUIT-2 cells were determined using FlowJo with the Dean–Jett–Fox model (with sync.peak). *p < 0.05, **p < 0.01, ***p < 0.001, and ****p < 0.0001 compared with the Scr group. The data are expressed as the means ± SEMs from three independent experiments (n ≥ 3). g, h Male NOD/SCID immunodeficient mice were subcutaneously injected in the back with tumor cells (Scr, Void, #1, and #4). g Tumor sizes were measured at various time points. *p < 0.05 and **p < 0.01 compared with the Scr group; ##p < 0.01, ###p < 0.001, and ####p < 0.0001 compared with the Void group. h Tumor sizes (left) and weights (right) in each group are shown. The data are expressed as the means ± SEMs (n = 7). #p < 0.05 and ##p < 0.01 compared with the Void group.

