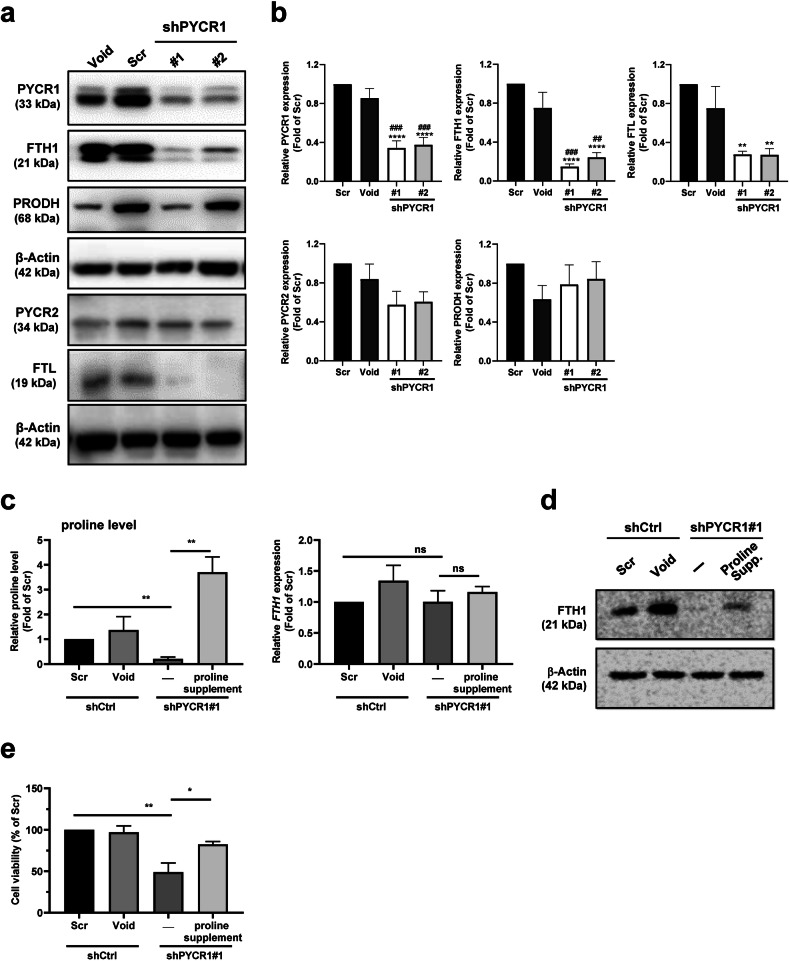
Fig. 6. Proline supplementation reversed changes in FTH1 protein expression and cell viability in PYCR1-knockdown cells.
a PYCR1 was knocked down through stable expression of shRNAs against PYCR1 from the following lentiviral expression constructs: Scr, Void (control), and shPYCR1#1 and shPYCR1#2. b Quantification of PYCR1, PYCR2, PRODH, FTH1, and FTL expression in the indicated cells was performed via ImageJ. Blots were normalized to β-actin, with bars indicating the mean fold change relative to Scr cell expression. The data are shown as the means ± SEMs; **p < 0.01, ****p < 0.0001 vs. the Scr group; ##p < 0.01 vs. the Void group. c Effects of PYCR1 knockdown and proline supplementation on proline levels and FTH1 mRNA expression. Left panel: Proline levels relative to those in the Scr control group in shCtrl, shPYCR1#1, and 200 μM proline-supplemented shPYCR1#1 cells. Right panel: FTH1 mRNA expression relative to that in the Scr control group under the same conditions. Bars represent the mean ± SEM; **p < 0.01 indicates significance, while ns denotes not significant. d Western blot analysis showing the protein expression of FTH1. The expression was compared across SUIT-2 cells with control shRNA (Scr and Void), without treatment (−), and cells with 200 μM proline supplementation (Proline Supp.) following shPYCR1#1 knockdown. β-Actin served as a loading control. e MTT assay-based cell viability assessment in SUIT-2 cells following shRNA-mediated knockdown and 48-hour proline supplementation. Viability percentages are relative to those of the Scr control group, indicating the effects of scrambled shRNA (Scr), vector control (Void), shRNA control (shCtrl), and PYCR1 knockdown (shPYCR1#1) with or without the addition of 200 μM proline for 48 hr. The data are shown as the mean ± SEM; *p < 0.05, **p < 0.01.

