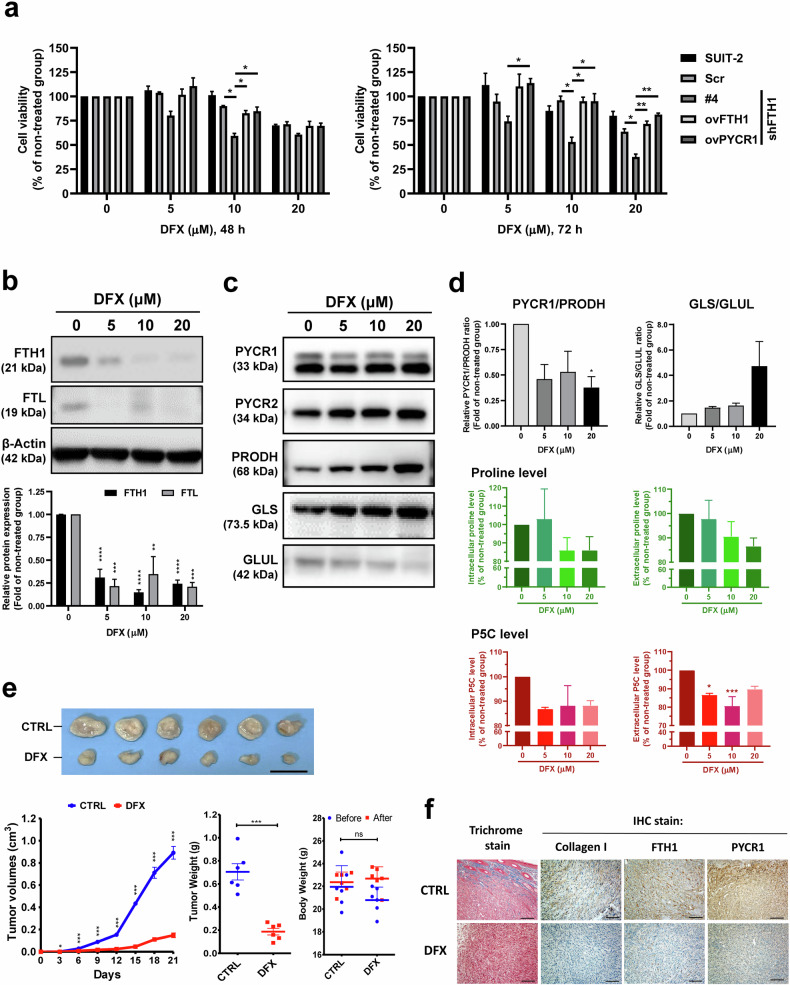
Fig. 8. DFX treatment significantly reduces FTH1-mediated tumor growth.
a The effect of deferasirox (DFX) on the viability of SUIT-2 cells and various genetically modified cell lines. The left graph displays cell viability after 48 h of treatment with 0, 5, 10, or 20 µM DFX, while the right graph shows the results after 72 h of treatment. The following cell lines were used: parental SUIT-2, scrambled control (Scr), shFTH1 clone #4 (shFTH1#4), and cells overexpressing FTH1 (ovFTH1) and PYCR1 (ovPYCR1). Viability is presented as a percentage of the untreated control group for each cell line, with bars denoting the mean ± SEM. Significance is indicated by *p < 0.05 and **p < 0.01. b The immunoblots at the top display bands for FTH1 and FTL after 48 hr of treatment with 0, 5, 10, or 20 µM DFX. β-Actin served as the loading control. The bar graph below shows the quantified protein expression normalized to that in the untreated group, with black bars representing FTH1 and gray bars representing FTL. The data are presented as the mean ± SEM (***p < 0.001). c The blot displays bands for PYCR1, PYCR2, PRODH, GLUL, and GLS at DFX concentrations of 0, 5, 10, and 20 µM. β-Actin served as a loading control. d Top panels display the relative enzyme expression ratios of PYCR1/PRODH and GLS/GLUL, normalized to the untreated control. The bottom panels show the intracellular and extracellular levels of proline and P5C (pyrroline-5-carboxylate), which are presented as percentages of those in the nontreated group. All of the data are presented as the means ± SEMs after treatment with 0, 5, 10, or 20 µM DFX. *p < 0.05, ***p < 0.001. e Top, Representative images of tumors excised from mice pretreated with PBS (CTRL) or DFX (160 mg/kg). Scale bars: 20 mm. Bottom left–tumor growth curves at 21 days postimplantation of 1 × 10⁶ DesPanc03 mouse pancreatic cancer cells, with DFX treatment continuing every three days. Bottom middle—Final tumor weight comparison indicating a significant reduction in the DFX group. Bottom right—No significant changes in body weight suggest minimal systemic toxicity of DFX. f Trichrome and IHC staining of tumor sections for collagen I, FTH1, and PYCR1 reflecting the microenvironmental alterations caused by DFX treatment. The data are shown as the mean ± SEM, with *p < 0.05, ***p < 0.001 indicating significance, and ns denoting nonsignificance. Scale bars: 100 µm.

