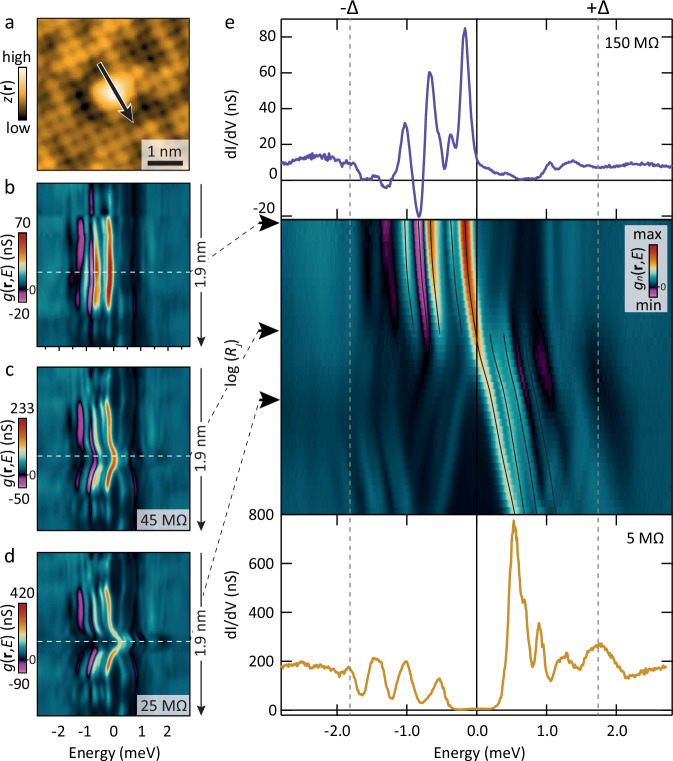
Fig. 2. Crossing zero energy.
a Constant current image of FeSe0.45Te0.55 with an excess Fe atom in the middle. b–d Differential conductance taken along the line in panel a for 150 MΩ, 45 MΩ and 25 MΩ, respectively. Directly on top of the Fe impurity the in-gap states shift most dramatically and cross zero. e Junction resistance dependence (middle) of the normalized differential conductance directly above the Fe impurity (white dashed lines in b–d) ranging from 150 MΩ (top) to 5 MΩ (bottom), the dashed gray lines mark the gap edges. The step size in resistance uses a logarithmic scale, the black lines are guides to the eye. As soon as the first state crosses zero, the intensity of all others is affected. We note that since the spectra are normalized outside the gap and since there is no dramatic change in intensity without a crossing (Fig. 1d) or of the state crossing zero, the intensity switch of the other states is not an artifact of normalization. The disappearance of NDC (purple, zero dI/dV is black and marked in the color legends) can moreover not be due to normalization, and un-normalized spectra in panel d also clearly show the switch. Source data are provided as a Source Data file.

