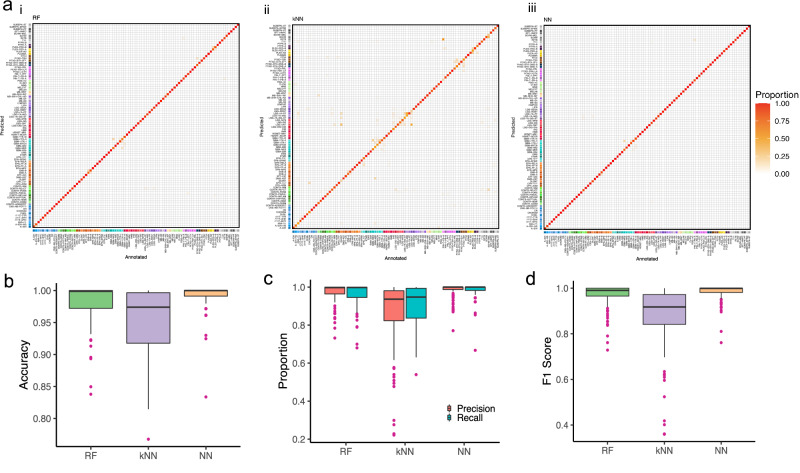
Fig. 1. Leave-out-25% testing results for each methylation class.
a Heat map showing results of methylation class prediction after 1000 stratified random samplings of i RF, ii kNN, and iii NN classifier incorporating information of n = 2801 reference tumor samples allocated to 91 methylation classes (GSE90496). Deviations from the bisecting line represent misclassification errors (using the maximum calibrated score for class prediction). Boxplots showing (b) the accuracy, (c) precision and recall, and (d) F1-score for each classifier with outliers.

