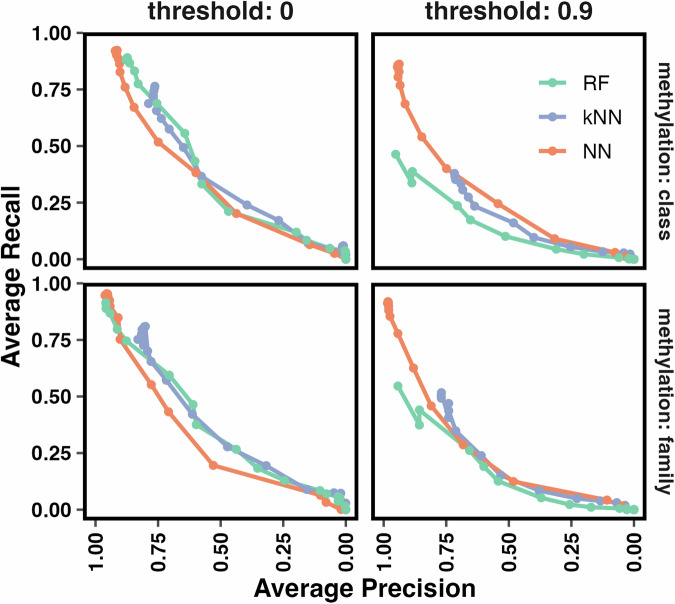
Fig. 4. Average precision and recall of each classifier at different purity fractions per 0 and 0.9 threshold.
Tumor samples from GSE109379 were mixed with control samples (as indicated in Supplemental Table 2) to create different fractions of normal vs tumor mixture. The average precision and recall for predicting methylation classes and families by RFmod (green), kNNmod (purple), and NNmod (orange) were computed for different mixed fractions of GSE109379 (0 to 0.95 purity—points on the lines) at 0 and 0.9 threshold.

