
Figure 1.
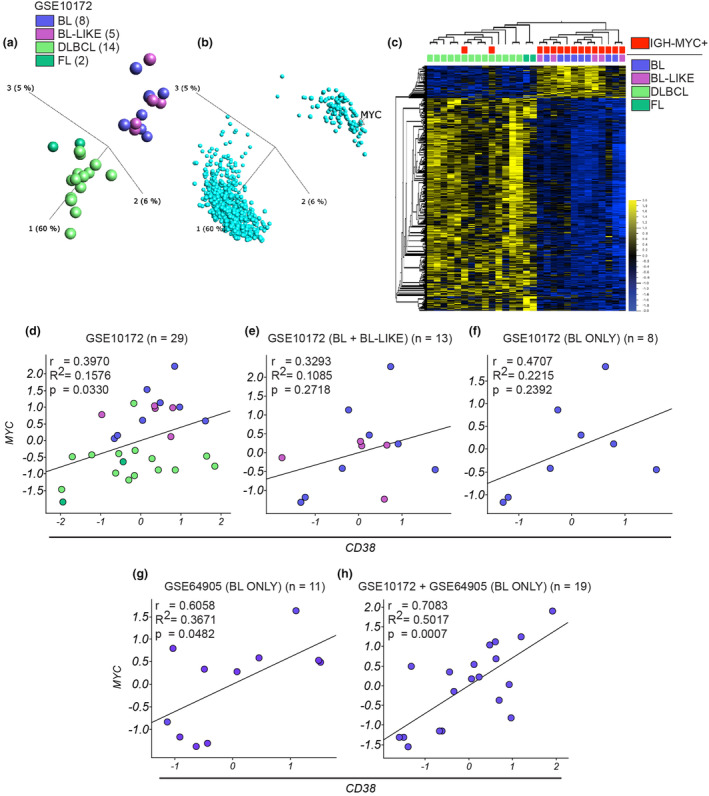
Correlation analysis of CD38 and MYC gene expression in pBL patient samples. (a) Unsupervised PCA analysis shows the cluster pattern of the 29 paediatric lymphoma samples (GSE10172) based on significantly differentially expressed genes among these samples (1800 genes, one‐way ANOVA with the post hoc Tukey test P = 0.01); the colour key for disease subtypes in this panel is consistent with those used in the following panels of this figure. (b) PCA chart shows the distribution of the significantly differentially expressed genes that lead to the samples clustering in a. (c) Heatmap shows the 1800 significantly differentially expressed genes and the hierarchical distribution of the samples reflecting the clustering in a. The disease subtype and absence/presence of the IgH‐MYC translocation related to these samples are also reported. Correlation analysis for MYC and CD38 gene expression was performed on the samples contained in the dataset GSE10172 and Pearson's correlation coefficient (r), coefficient of determination (R 2) and P‐value were calculated for (d) the whole 29 samples contained in the data set, (e) only for BL and BL‐like samples, (h) only for BL samples. (g) Same analysis as in (d–f) but on 11 pBL samples contained in the GSE64905 dataset. (h) Same analysis as in (d–g) but on 19 pBL samples contained in GSE10172 and GSE64905 data sets. Here, the data sets were merged and normalised using the Z‐score normalisation method.