Figure 3.

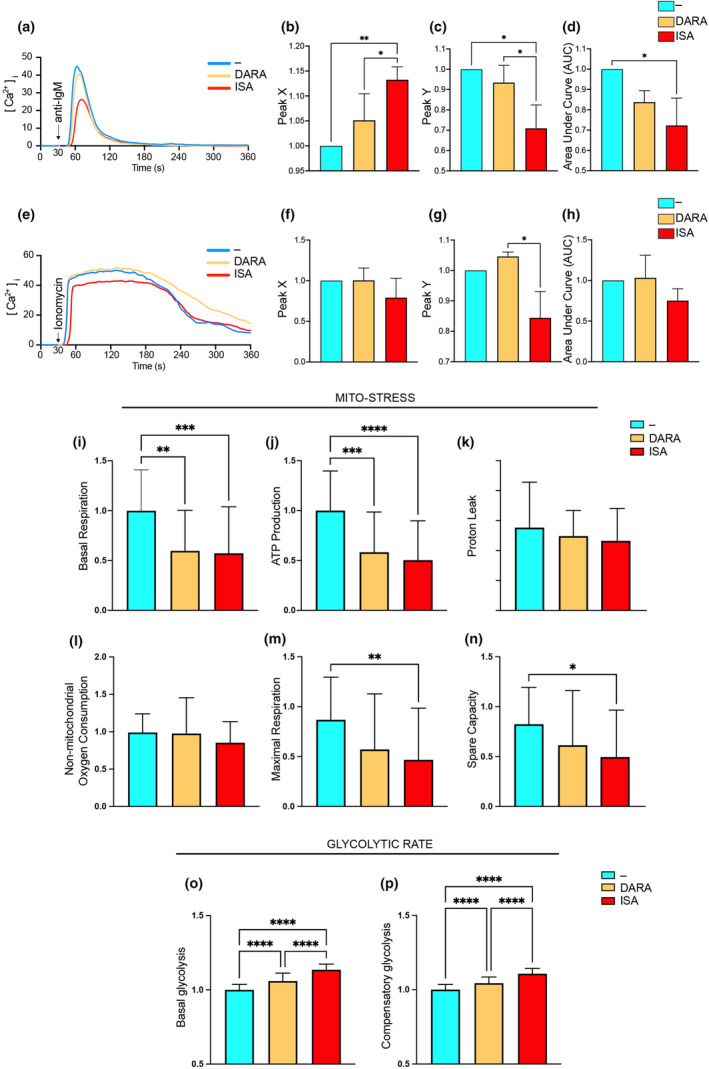
DARA and ISA impact on intracellular Ca2+ signalling and metabolic changes in pBL cells. (a) Transient rise in [Ca2+]i over time in Ramos cells, untreated (−) or treated with DARA or ISA, following stimulation with anti‐IgM, F(ab')2. The curves illustrate the temporal dynamics of [Ca2+]i. (b) Peak X indicates the time (seconds, s) to reach maximum [Ca2+]i, (c) Peak Y the maximum [Ca2+]i achieved and (d) the Area Under Curve (AUC) the total Ca2+ released. (e) Transient rise in [Ca2+]i over time in Ramos cells, untreated (−) or treated with DARA or ISA, following stimulation with ionomycin. The curves illustrate the temporal dynamics of [Ca2+]i. (f) Peak X indicates the time (seconds, s) to reach maximum [Ca2+]i, (g) Peak Y the maximum [Ca2+]i achieved and (h) the Area Under Curve (AUC) the total Ca2+ released. (i–p) Ramos cells, untreated (−) or treated with DARA or ISA for 1 h were assessed for metabolic changes involving mitochondrial respiration (Mito‐stress) and glycolysis (Glycolytic rate). (i) Basal respiration rates and (j) ATP production. (k, l) Proton leak and non‐mitochondrial oxygen consumption, respectively. The maximal respiration rate and spare respiratory capacity were depicted in m and n. Glycolytic function is assessed in (o) and (p) where basal and compensatory glycolysis levels were shown. Statistical significance was calculated with one‐way ANOVA with the post hoc Tukey test and denoted as *P < 0.05; **P < 0.01; ***P < 0.001; ****P < 0.0001. Data are presented as mean ± SD. Non‐significance is not indicated in the figure. (a–n) Data presented are from three independent experiments, with results normalised and combined. (o, p) Data presented are from two independent experiments, with results normalised and combined.
