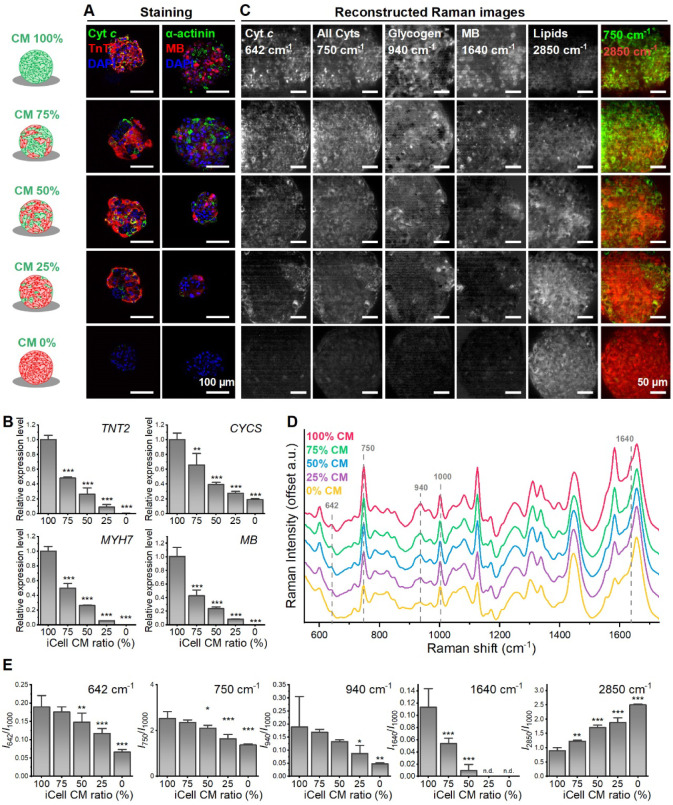
Figure 1.
Raman observation on mixture of iCell with fibroblast. (A) Representative confocal images of iCell/fibroblast spheroid with different mixing ratio on day 3. The spheroids were stained with anti-TnT2, anti-cytochrome c (Cyt c), anti-α-actinin, anti-myoglobin (anti-MB), and DAPI. (B) Relative gene expression of TnT2, cytochrome c (CYCS), β-Myosin Heavy Chain (MYH7), myoglobin (MB) (Mean ± SD, n = 3 biologically independent samples, **p < 0.01, ***p < 0.001). (C) Reconstructed Raman images at 642, 750, 940, 1,640, and 2,850 cm–1. (D) Comparison of average Raman signal for iCell/fibroblast spheroid with different mixing ratios. (E) Quantitative analysis of the Raman intensity at 642, 750, 940, 1,640, and 2,850 cm–1 (mean ± SD, n = 3 biologically independent samples, *p < 0.05, **p < 0.01, ***p < 0.001).

