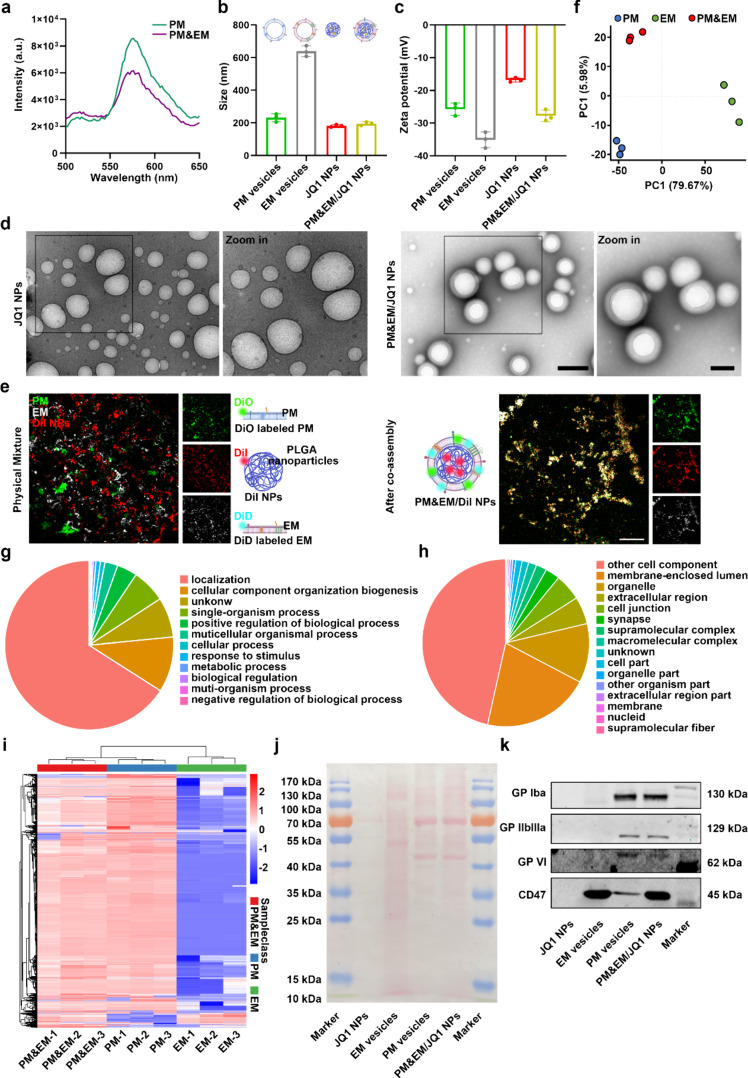
Figure 2.
Preparation and characterization of PM&EM/JQ1 NPs. (a) The lipid membrane is labeled with FRET dye for DiO and Dil and then fused with the platelet membrane. The fluorescence intensity was recorded. (b) The particle size was measured by dynamic light scattering (DLS) (mean ± SD, n = 3). (c) Zeta potential distribution (mean ± SD, n = 3 independent experiments) of platelet membrane vesicles, erythrocyte membrane vesicles, JQ1 NPs, and PM&EM/JQ1 NPs. (d) Representative TEM image of PM&EM/JQ1 NPs. Scale bar = 100 nm. (e) CLSM image of PM&EM/JQ1 NPs. Two membranes and a physical mixture of PLGA coated with DiI fluorescein were used as controls. Scale bar = 20 μm. (f) Principal component analysis (PCA) and the 2D score plots display repertoires of PM vesicles, EM vesicles, and PM&EM vesicles. Each point represents a sample, and ellipses represent 95% confidence regions (mean ± SD, n = 3 independent experiments). (g) Classification of PM&EM/JQ1 NPs proteins by the biological process. (h) Classification of PM&EM/JQ1 NP proteins by cellular component. (i) Heatmap of protein levels from PM&EM NPs, PM NPs, and EM NPs. (mean ± SD, n = 3). (j) Protein composition of PM&EM/JQ1 NPs was shown by SDS-PAGE analysis. (k) Analysis of PM&EM/JQ1 NPs through Western Blot to achieve targeting and immune evasion of key protein receptors.

