Figure 5.
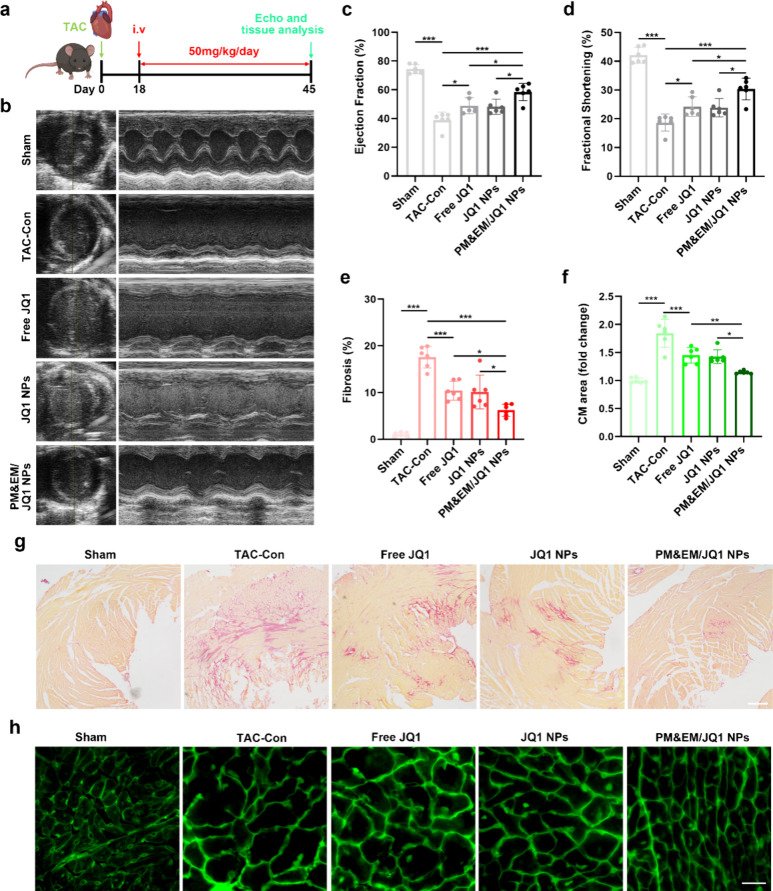
Evaluation of the therapeutic effect of novel drug-loaded systems in TAC-induced cardiac insufficiency in mice. (a) Experimental protocol and dosing protocol of pre-established TAC-induced mouse stress overload model. (b) Representative plot of mouse cardiac ultrasound 45 days after construction of the TAC model. (c) Left ventricular ejection fraction quantified by echocardiography. (d) Left ventricular minor axis contraction (mean ± SD, n = 6). (e) Quantification of fibrotic area in the sham group, TAC model group, and TAC with different treatment group (mean ± SD, n = 6). (g) Representative cross sections from remote LV stained with Sirius red; scale bar = 100 μm. (f) Statistical plot of changes in cardiomyocytes area stained with wheat germ agglutinin (WGA) (mean ± SD, n = 6) and (h) representative LV cross-section stained with WGA, scale bar = 20 μm. *p < 0.05, **p < 0.01, and ***p < 0.001, one-way ANOVA, Tukey’s multiple comparison test.

