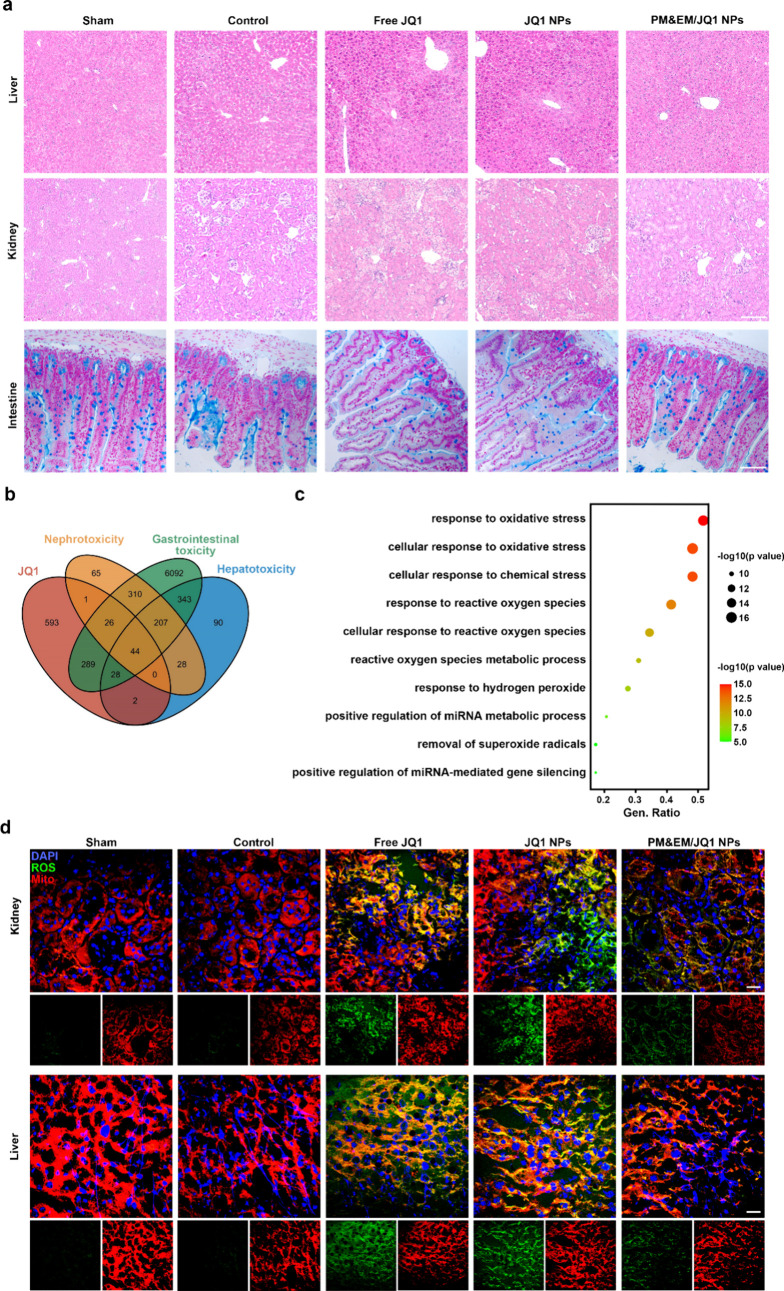
Figure 8.
Biosafety analysis of JQ1, JQ1 NPs and PM&EM/JQ1 NPs. (a) Representative cross section from liver and kidney stained with H&E and intestines with Alcian blue, scale bar = 100 μm. (b) Venn diagrams of JQ1, nephrotoxicity, gastrointestinal toxicity, and hepatoxicity related gene from GENCARDS. (c) GO pathway enrichment analysis (biological process, BP) of the common gene from different groups. (d) Immunofluorescence staining of mitochondria (Mito, red) and reactive oxygen species (ROS, green) in the kidney and liver. Nuclei were counterstained with DAPI (blue); scale bar = 20 μm.

