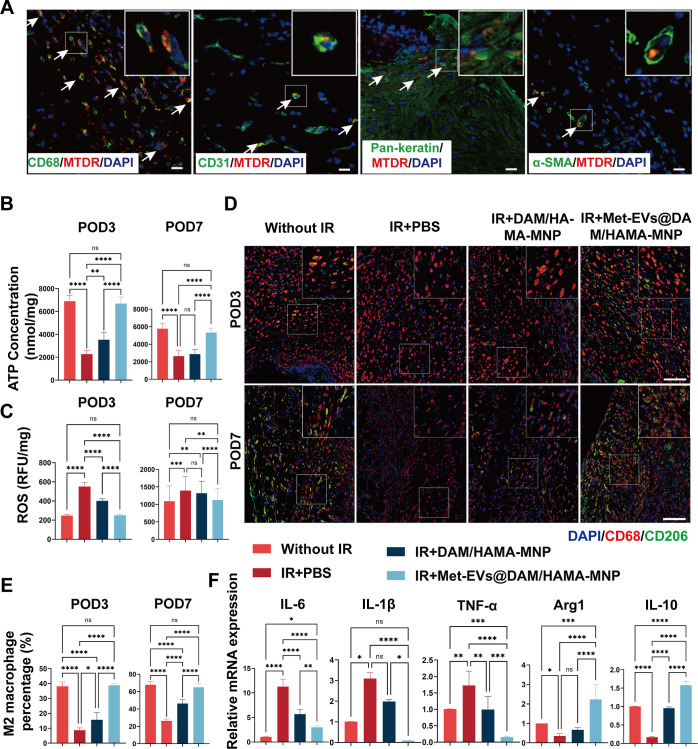
Figure 7.
Histological analysis of healed wounds in mice on POD3 and 7. (A) Met-EVs containing MTDR (red)-labeled mitochondria were delivered to the wound, and 3 days later, the tissue was excised and immunofluorescently stained to observe the delivery of mitochondria by Met-EVs to macrophages (CD68, green), vascular endothelial cells (CD31, green), epithelial cells (Pan-keratin, green), and myofibroblasts (α-SMA, green) under CLSM. MTDR-labeled mitochondria (indicated by white arrows) were captured in the wound tissues. Scale bar, 50 μm. (B) ATP content of wound tissues was measured on POD3 and 7 (n = 6). (C) ROS levels in wound tissues were measured on POD3 and 7 (n = 6). (D) Representative images of the wound tissue stained with CD68 (red) and CD206 (green) on POD3 and 7. Scale bar, 100 μm. (E) Percentage of M2-subtype macrophages (cell number ratio of CD206+ cells to CD68+ cells) in wound tissues on POD3 and 7 (n = 4–6). (F) Relative mRNA expression of IL-6, IL-1β, TNF-α, arginase 1 (Arg1), and IL-10 were examined in the wound tissues on POD7 (n = 4–6). ns p > 0.05, *p < 0.05, **p < 0.01, ***p < 0.001, and ****p < 0.0001. POD, postoperative day; Met, metformin; EVs, extracellular vesicles; MTDR, MitoTracker Deep Red; α-SMA, alpha-smooth muscle actin; CLSM, confocal laser scanning microscopy; ROS, reactive oxygen species; IL, interleukin; TNF-α, tumor necrosis factor-α.

