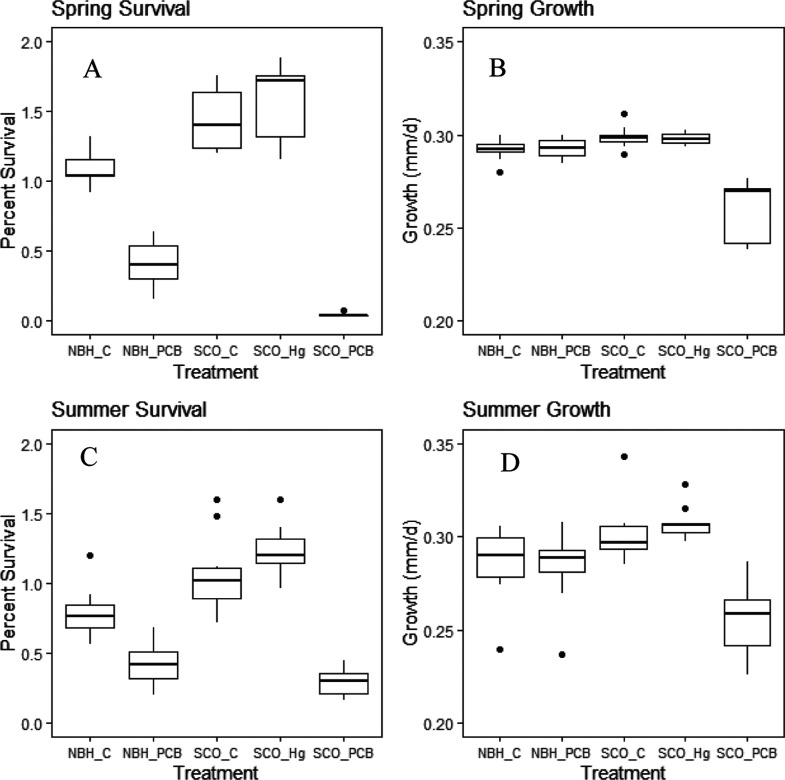
Figure 2.
Simulated mean percent survival and growth (mm/d) of Atlantic killifish juvenile survivors for 10 replicates of each treatment for spring and summer scenarios. Presented are box plots showing the mean (bold line), interquartile range (box), 95th percentiles (vertical lines), and 100th percentiles (dots). SCO = Scorton Creek, NBH = New Bedford Harbor, Hg = methylmercury treatment, PCB = PCB126 treatment, and C = control treatment (treatment means reported in Table S25).

