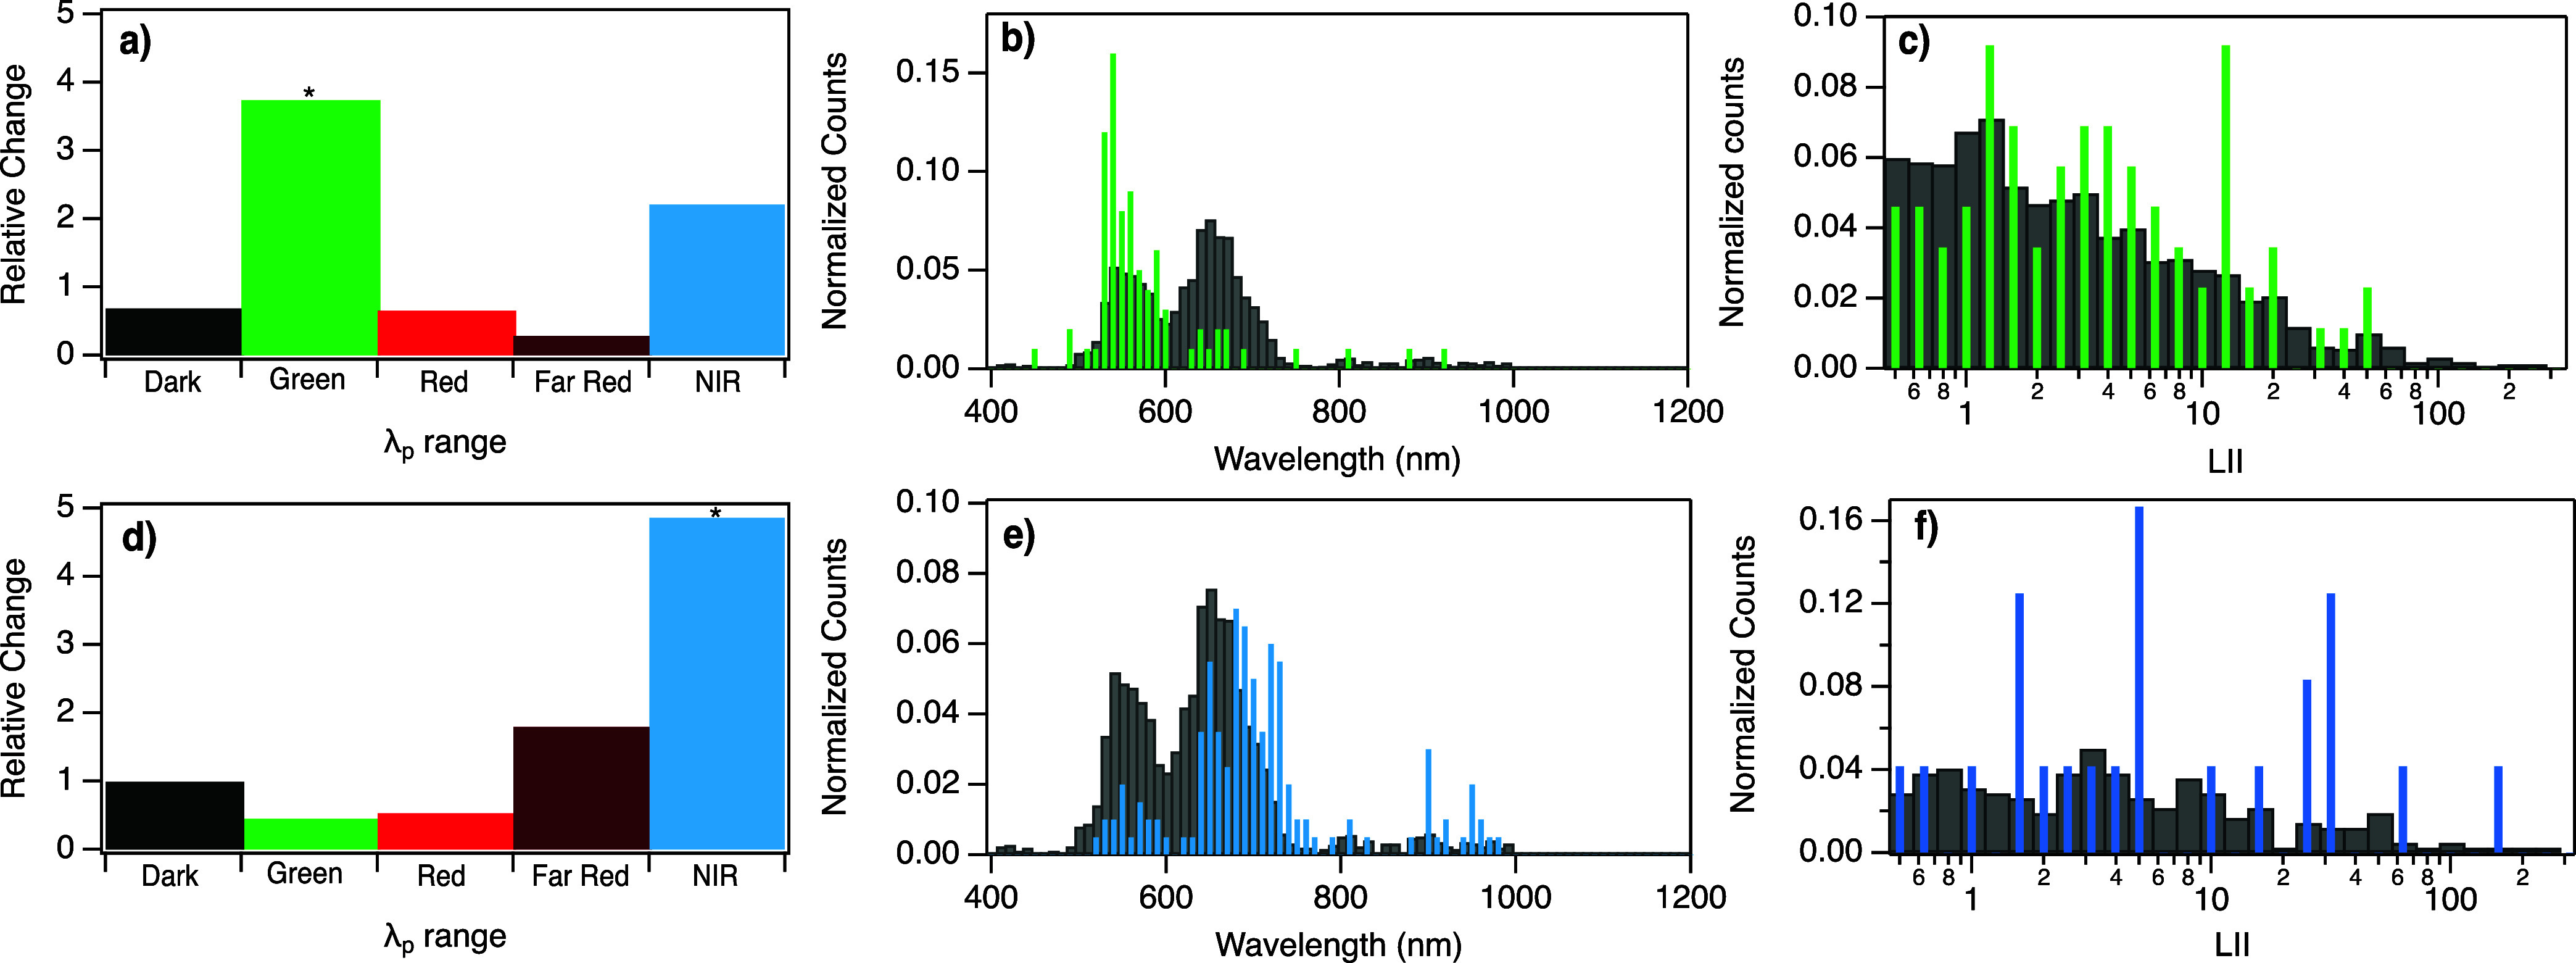
Figure 6.

Relative change in the number of sequences in each λp range with high LII value >1 and the number of sequences with “Dark” LII < 0.5, for sequences generated using the stratified VAE to be (a) Green and (d) NIR. All fluorescent peaks with LII > 1 for (b) Green designed template sequences (green bars) and (e) NIR designed template sequences (blue bars), as compared to training data (gray bars). LII values for (c) all Green products, compared to Green products in the training data set, and (f) all NIR products, compared to NIR products in training data.
