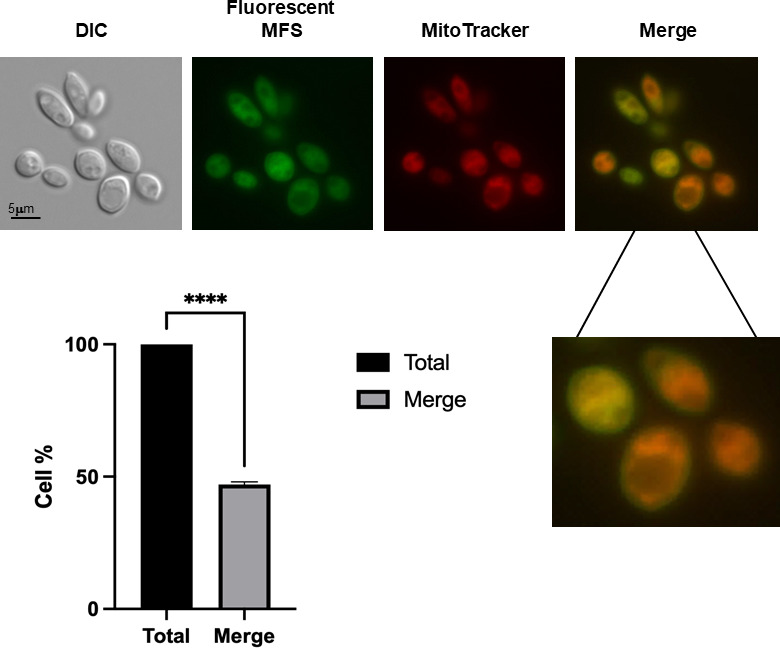
Fig 3.

MFS is localized in the mitochondria and cell surface of S. brasiliensis yeast. S. brasiliensis yeast cells were exposed to fluorescent MFS (2 µg/mL) for 1 h and then stained with MitoTracker Deep Red FM. The MFS and MitoTracker signals merged on the mitochondria, whereas the MFS signal was observed on the cell surface. Three independent experiments were performed, and 100 cells were counted for each to calculate a 47.06% ± 1.01% of MFS and MitoTracker colocalization (merge).
