. 2024 Oct 1;9(1):e001855. doi: 10.1136/bmjophth-2024-001855

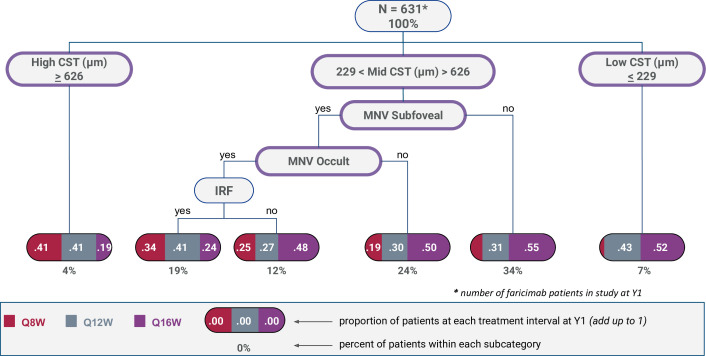
Figure 2. Classification tree model based on all ocular baseline characteristics from table 1 except low luminance deficit, MNV lesion size and presence of subretinal fluid in centre 1 mm. Top of the tree is all the patients from the faricimab treat and extend interval arm (631). The clinician follows each layer till they get to one of the five terminal nodes at the bottom of the tree. Below each terminal node is the percentage of patients that followed those decisions to get to the terminal node. Within each terminal node are the three treatment intervals the patients were on at the end of year 1 (Q8W=grey, Q12W=purple and Q16W=red). CST, central subfield thickness; MNV, macular neovascularisation; IRF, intraretinal fluid in centre 1 mm.

Figure 2