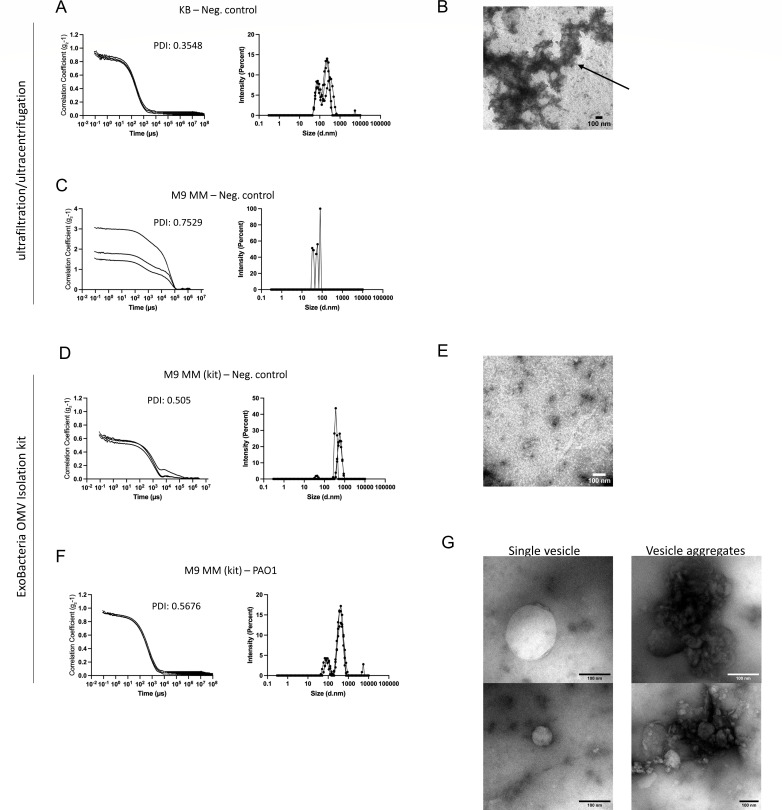
Fig 4.
Analysis of growth media for vesicle purification by DLS showing (A, C, D, F) the results of sample analysis using DLS (Zetasizer). A correlogram (left) and a graph indicating size distribution by intensity (right) are shown for each set. (A–C) An ultracentrifugation/ultrafiltration protocol was used with (A and B) King B medium without bacteria (negative control for KB) and (C) M9 medium without bacteria (negative control for M9 medium). (D–G) ExoBacteria OMV Isolation Kit was used to purify vesicles/particles from M9 minimal medium: (D–E) without bacteria (negative control for M9 minimal medium) or (F and G) inoculated with P. aeruginosa PAO1 strain. The three curves in each graph represent the three readings of the instrument (triplicate). PDI, polydispersity index. (B, E, G) Electron microscopy images of (B) samples obtained with ultrafiltration/ultracentrifugation, protein aggregates (black arrow) of KB medium without bacteria; (E) samples obtained with ExoBacteria OMV Isolation kit M9 minimal medium (negative control); (G) vesicles of P. aeruginosa PAO1 grown in M9 minimal medium.

