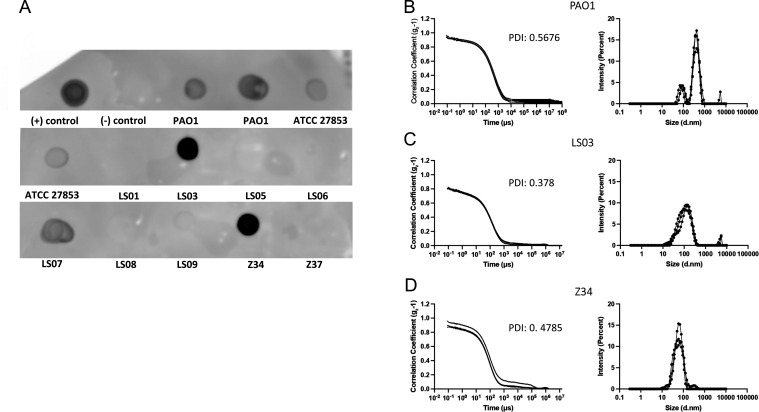
Fig 5.
Immunodetection of porin OprF by dot blot and DLS analysis. (A) Dot blot using anti-OprF antibody. Samples eluted by Exobacteria OMV Isolation kit were spotted onto nitrocellulose membrane and used for dot blot. The positive (+) control corresponds to the first antibody solution and negative (−) control to blocking solution (3% BSA in TBS). Control strains were blotted twice (PAO1 from different purifications). (B–D) Analysis of eluates that showed the highest dot blot signals by DLS (Zetasizer). The curves obtained for (B) PAO1, (C) LS03, and (D) Z34 samples are shown. The three curves in each graph indicate the triplicate readings of the instrument. PDI, polydispersity index.

