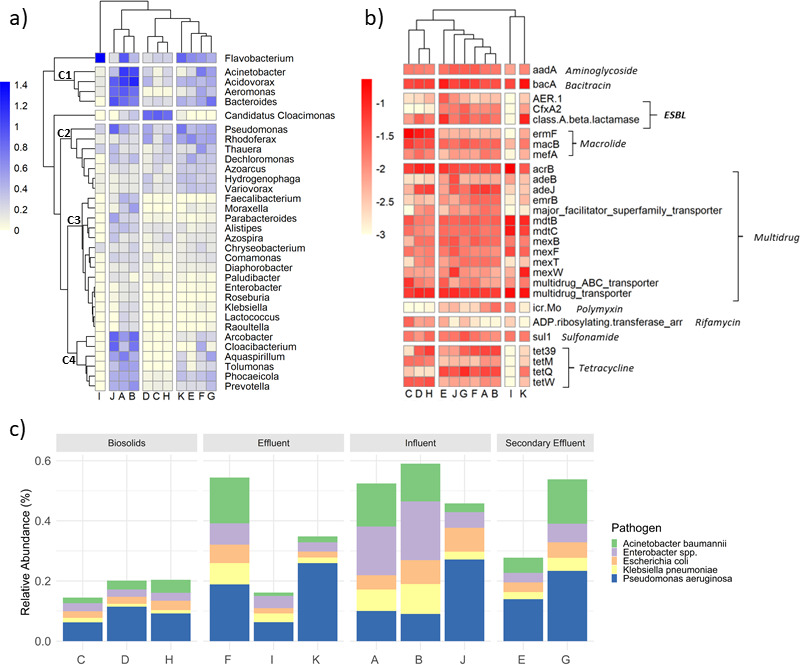
Fig 4.

Microbial community and resistome of ESBL-producing E. coli-originating wastewater samples. Letters A–K correspond to wastewater sample IDs. (a) Heatmap of the relative abundance of the microbial genera present above 0.1% (log-scale). (b) Heatmap of the antibiotic resistance gene concentrations (gene copies/16S rRNA, log-scale) grouped by their corresponding antibiotic class. (c) Relative abundance of ESKAPE pathogens and E. coli with samples grouped according to wastewater sample type.
