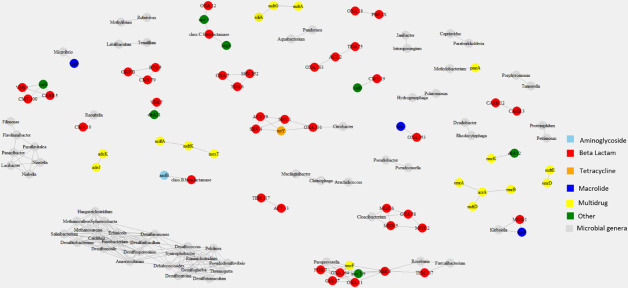
Fig 5.
Network analysis of microbial genera and antibiotic resistance genes in wastewater samples. Edges represent statistically significant Spearman correlations (P < 0.01) of nodes with a neighborhood of three or more. Colored symbols indicate antibiotic resistance genotypes, and gray symbols represent the microbial genera.

