
FIGURE 9.
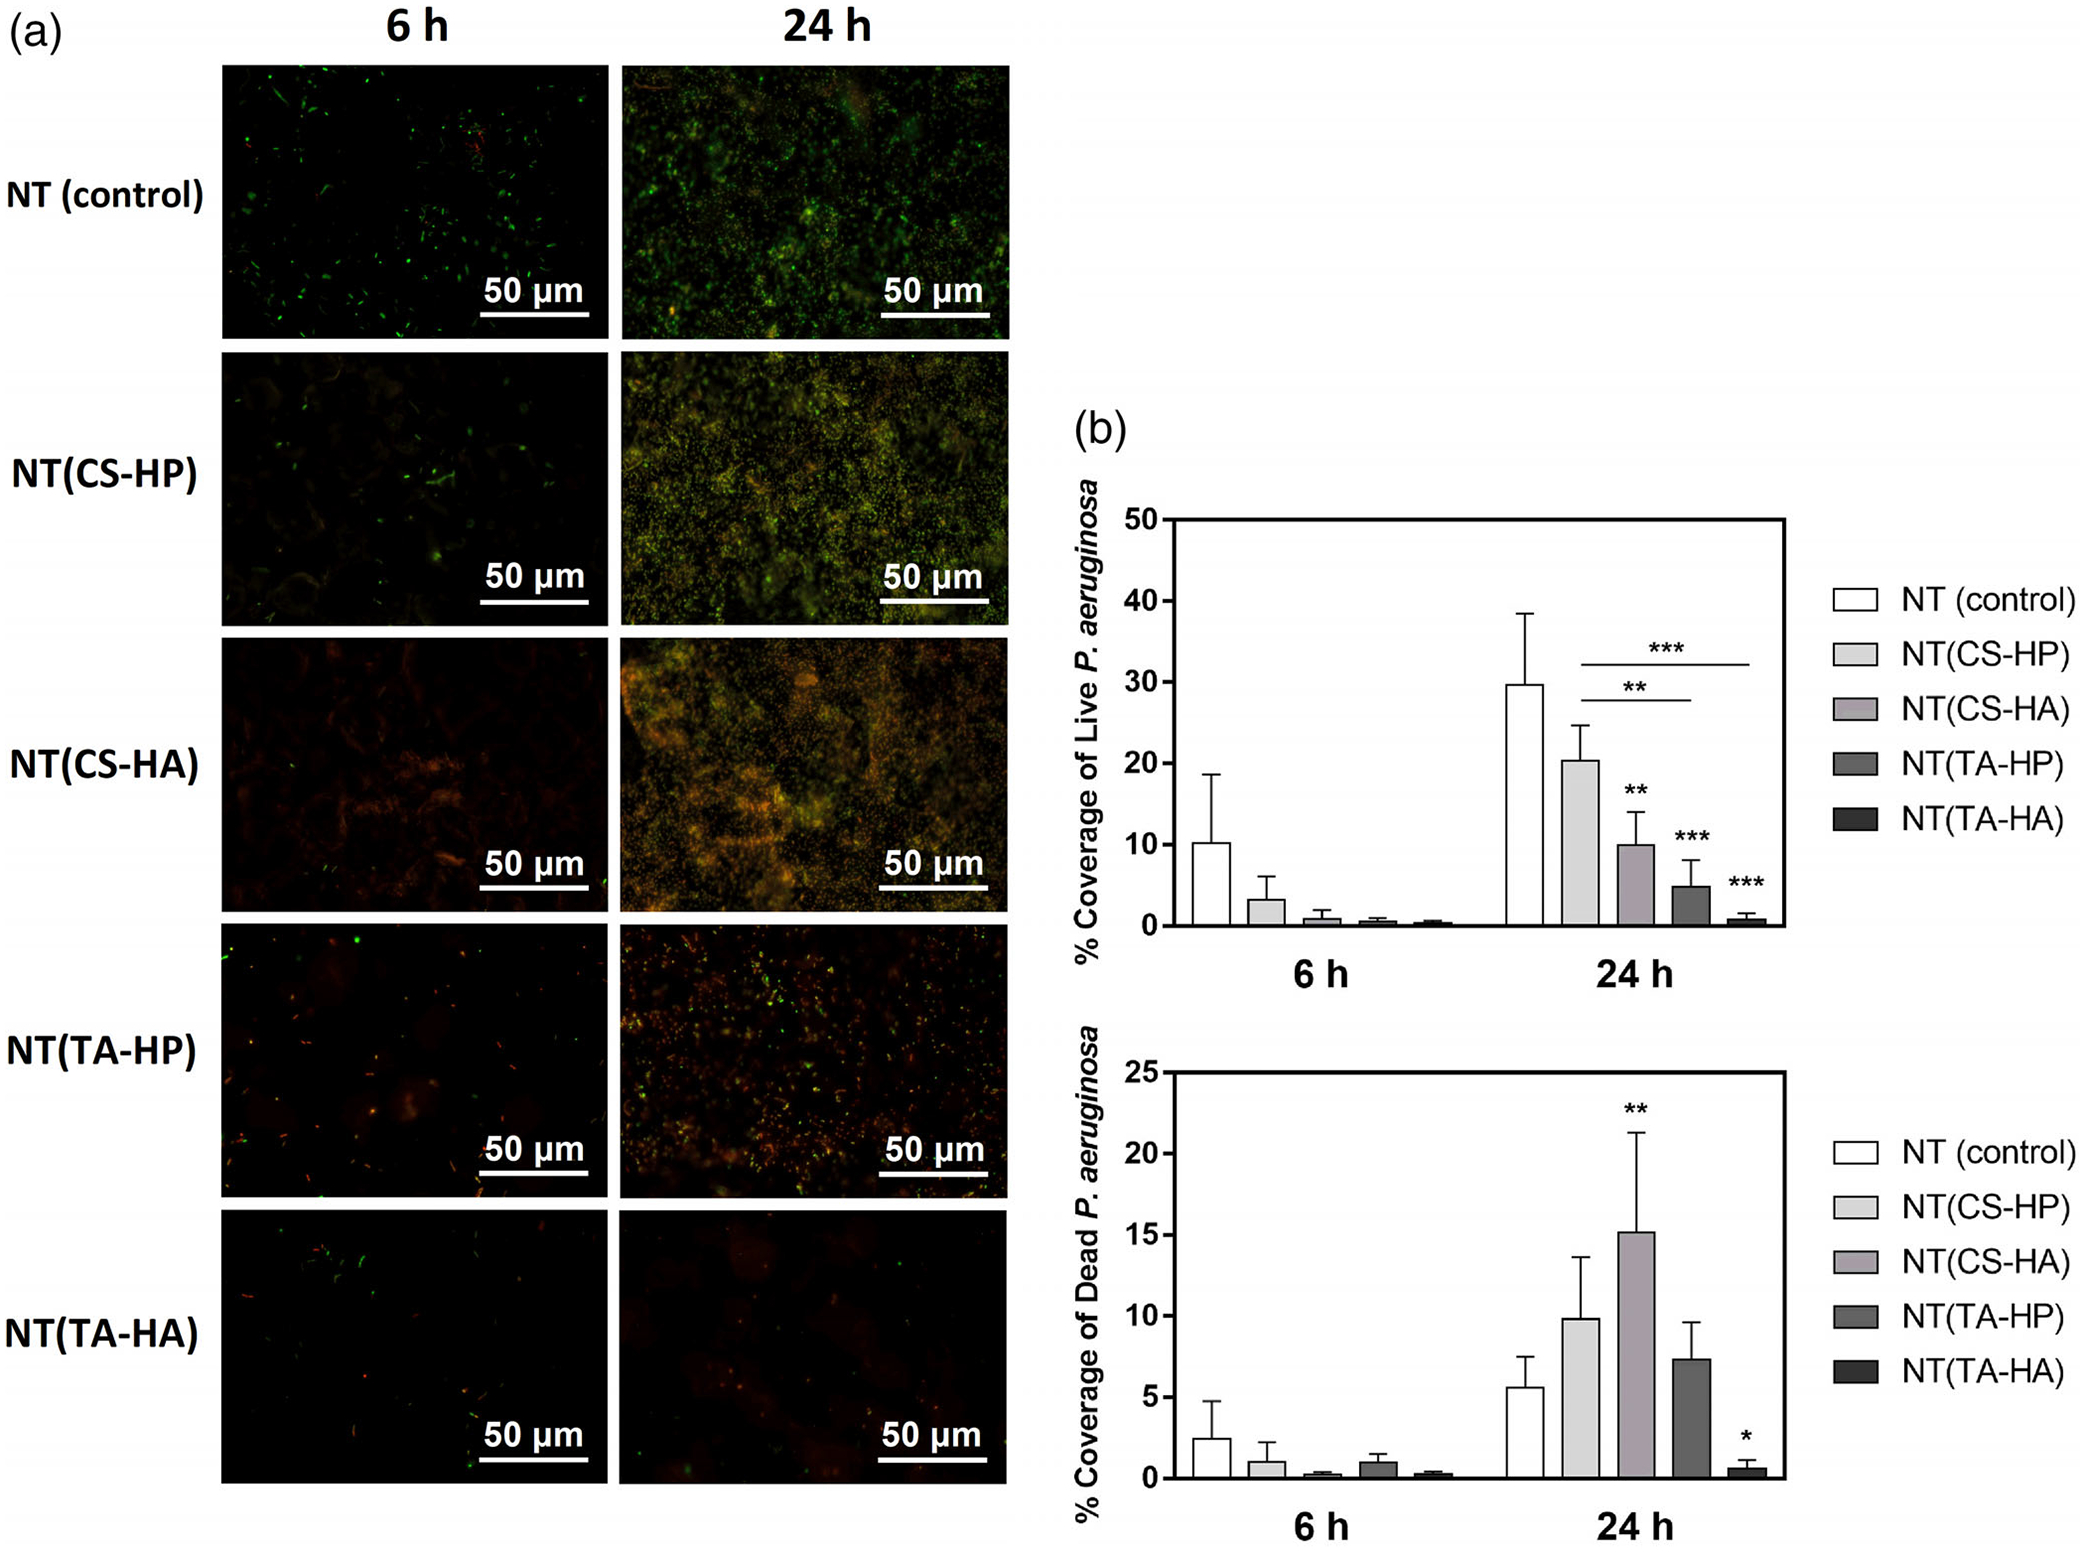
(a) Representative fluorescence microscopy images of P. aeruginosa on the different surfaces after 6 and 24 hr of incubation in bacteria solution. Green stain indicates live bacteria, and red stain indicates dead bacteria. (b) Live/Dead P. aeruginosa adhesion on different surfaces after 6 and 24 hr of incubation in bacteria solution. Experiments were conducted at least twice with three samples of each surface (nmin = 6). NT(CS-HA), NT(TA-HP), and NT(TA-HA) have significantly lower live bacteria adhesion than the NT surfaces (* indicates p ≤ .05; ** indicates p ≤ .01; *** indicates p ≤ .001)