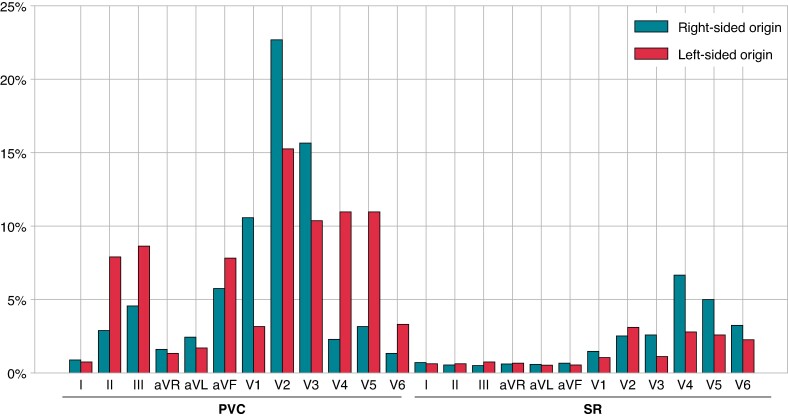
Figure 3.
The contribution of each ECG lead to the prediction of the right-sided and left-sided origins in all cases. X-axis represents the ECG leads for PVC and SR, and y-axis represents their percentage contribution. ECG, electrocardiogram; PVC, premature ventricular contraction; SR, sinus rhythm.

