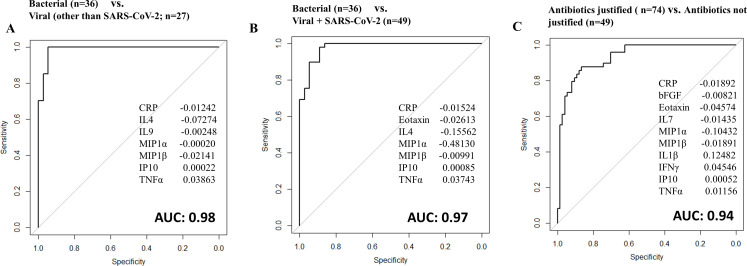
Fig 3.
Receiver operator characteristic (ROC) curves for protein signatures that distinguish (A) patients with bacterial from viral etiology, (B) patients with bacterial from viral and SARS-CoV-2 etiology, and (C) patients with bacterial and mixed bacterial–viral etiology (“antibiotics justified”) from patients with viral and SARS-CoV-2 etiology (“antibiotics not justified”).

