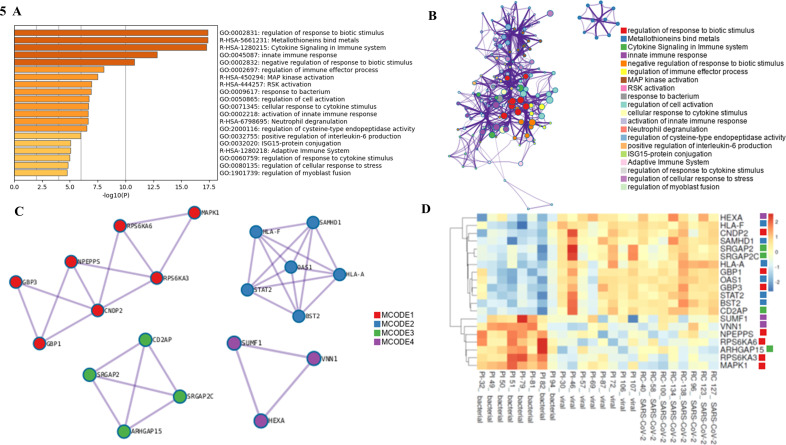
Fig 5.
(A) Bar graph of the top 20 enriched terms among the 232 genes represented in comparison of both bacterial vs viral and bacterial vs SARS-CoV-2 etiologies, colored by P-values. (B) Network plot of the top 20 enriched terms visualized using Cytoscape (http://www.cytoscape.org). Each term is represented by a circle node, where its size is proportional to the number of input genes falling under that term, and its color represents its cluster identity. (C) Protein–protein interaction networks identified using the MCODE algorithm. Enrichment analysis was applied to each MCODE network to explore their biological relationships, where the top 3 best P-value terms (if any) are presented: MCODE1 (consists of seven genes): (1) R-HSA-444257—RSK activation (P < 0.00001); (2) R-HSA-442742—CREB1 phosphorylation through NMDA receptor-mediated activation of RAS signaling (P < 0.00001); (3) R-HSA-437239—recycling pathway of L1 (P < 0.00001); MCODE2 (consists of six genes): (1) R-HSA-909733—interferon alpha/beta signaling (P < 0.00001); (2) R-HSA-913531—interferon signaling (P < 0.00001); (3) GO:0045824—negative regulation of innate immune response (P < 0.00001); MCODE3 (consists of four genes): (1) GO:0051056—regulation of small GTPase-mediated signal transduction (P < 0.00001); (2) GO:0050808—synapse organization (P < 0.00001); (3) GO:0120031—plasma membrane-bounded cell projection assembly (P = 0.00001); MCODE4 (consists of three genes): no enriched terms reported. (D) Heatmap generated for the 20 differentially expressed genes identified across all four MCODE networks, with columns representing samples and rows representing genes.

