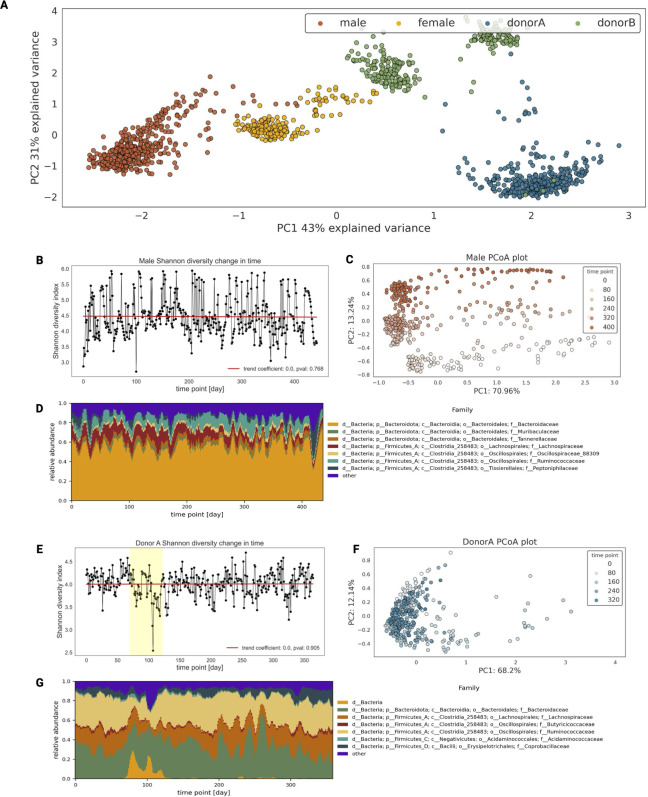
Fig 1.
Analysis of general behavior of gut microbiome in time. (A) The scatterplot of the two first coordinates of principal coordinate analysis (PCA) on Aitchinson distance. (B) Lineplot of male subject in Shannon’s diversity index over time. The red line represents the trend in Shannon’s diversity index over time, determined by fitting a linear regression model of alpha diversity against time. (C) Scatterplot of the two first coordinates of male subject PCoA on Aitchinson distance matrix. (D) Rolling mean of male subject taxonomy composition on family level in time (window = 14 days). (E) Lineplot of donor A in Shannon’s diversity index over time. The red line represents the trend in Shannon’s diversity index over time, determined by fitting a linear regression model of alpha diversity against time. The yellow box showcases days 70–122 when the subject was traveling. (F) Scatterplot of the two first coordinates of donor A PCoA on the Aitchinson distance matrix. (G) Rolling mean of donor A subject taxonomy composition on family level in time (window = 14 days).

