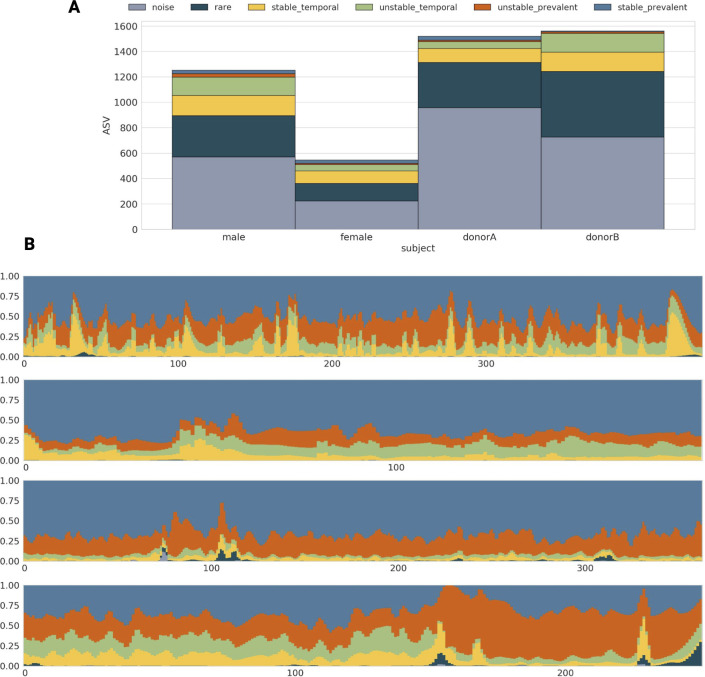
Fig 4.
Longitudinal characteristics of the human gut microbiome. (A) Barplots showing the number of bacteria exhibiting specific regimes in each subject. (B) The fluctuation in counts over time for each longitudinal regime using a stacked barplot. Panels represent male, female, donor A, and donor B regime fluctuations in time. The x-axis represents time points in days, and the y-axis represents relative abundance of particular regimes.

