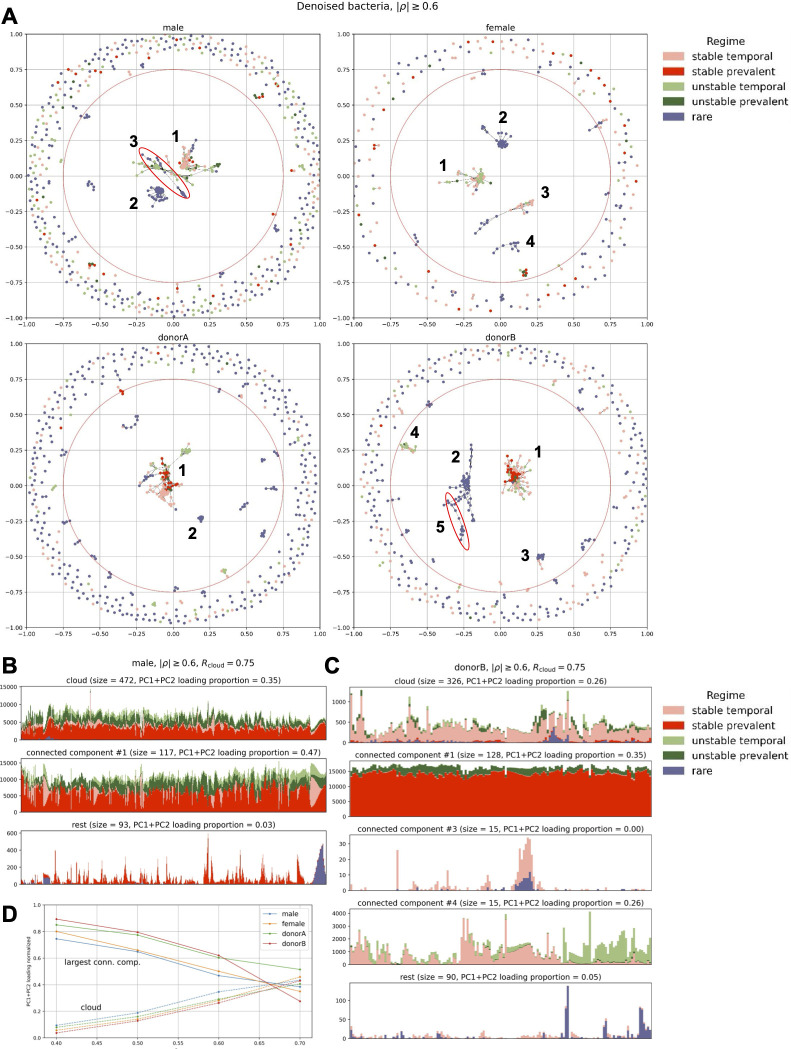
Fig 5.
Cluster analysis performed with NetworkX. (A) Network (one panel per subject) of bacterial species (nodes) where connections (edges) represent proportionality equal or stronger than ρthr = 0.6 (equivalent to |ρ| ≥0.6). Colors correspond to longitudinal regimes defined in the Individual Features Analysis section (“none” represents bacteria that did not pass rarefaction). The red circle in each panel separates the inner part from the “cloud.” (B) change in total counts after rarefaction over time for male subjects stratified by regime (color) and group of bacteria (panels), i.e., cloud, largest connected components (indicated by numbers in the graphs), and the rest. (C) The same as in panel B but for donor B. In panels B and C, we excluded components comprising only rare species. Rcloud represents a diameter that separates the inner part from the cloud. (D) PC1 + PC2 loading against ρthr for bacteria located in the cloud and largest connected components.

