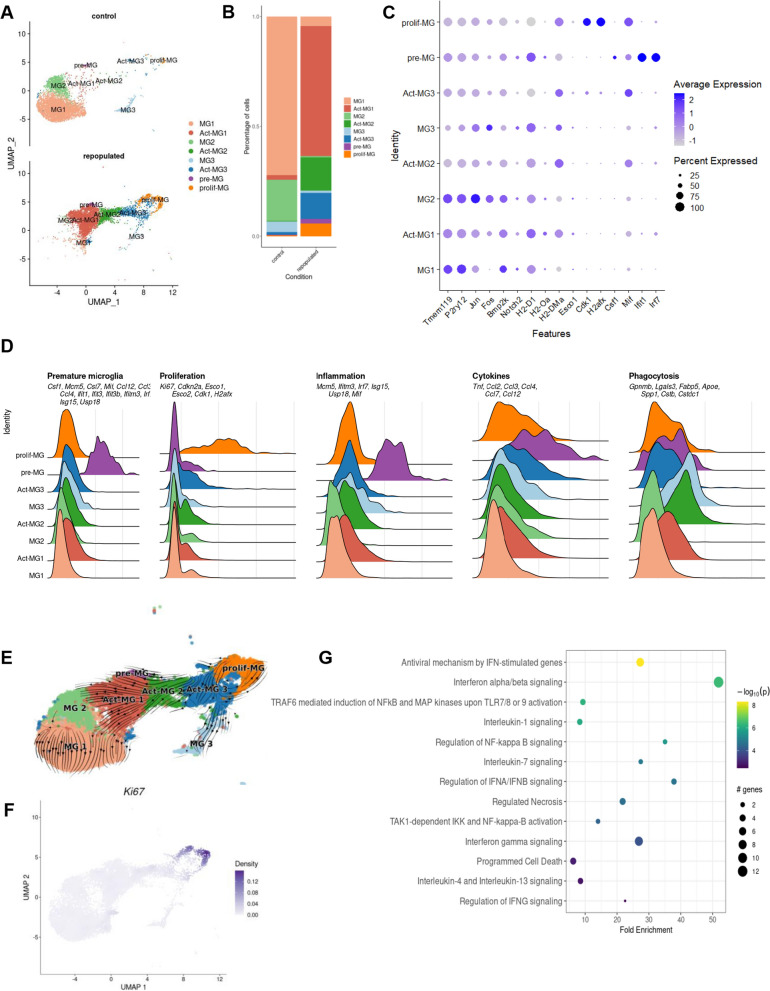
Fig. 2.
Characterization of the functional heterogeneity of repopulated microglia with single-cell transcriptomics. UMAP plot of scRNA-seq data showing cell clustering of control and repopulated MG. For each condition, four scRNA-seq replicates were combined. Cell clusters are colored and based on the annotations from [12, 15]. We identified MG1 homeostatic microglia, Act-MG1 activated microglia, MG2 transcriptionally active cells, Act-MG2 activated transcriptionally active cells, MG3 signaling inhibitors and transcriptional repressors, Act-MG3 activated signaling inhibitors and transcriptional repressors, pre-MG premature microglia, prolif-MG proliferating microglia. B The proportion of cells assigned into each cell cluster in two experimental groups (young controls and repopulated). C Dot plot showing the average expression levels of signature genes from previous studies [12] for the cell types or processes as defined above. D Ridge plots showing signature gene score profiles in each cell cluster associated with the specific cell types or processes: premature MG, proliferation, inflammation, cytokines, and phagocytosis. E UMAP plot overlaid with RNA velocity vectors (as quantified by scVelo), demonstrating expression dynamics across cell clusters of MG. Notably, all resulting clusters are derived from proliferating MG. F UMAP plot showing weighted kernel density [21] of scaled Ki67 gene expression. G Selected enriched Reactome terms in a set of the differentially expressed genes in the premature MG (pre-MG) cluster compared with other cell clusters from A

