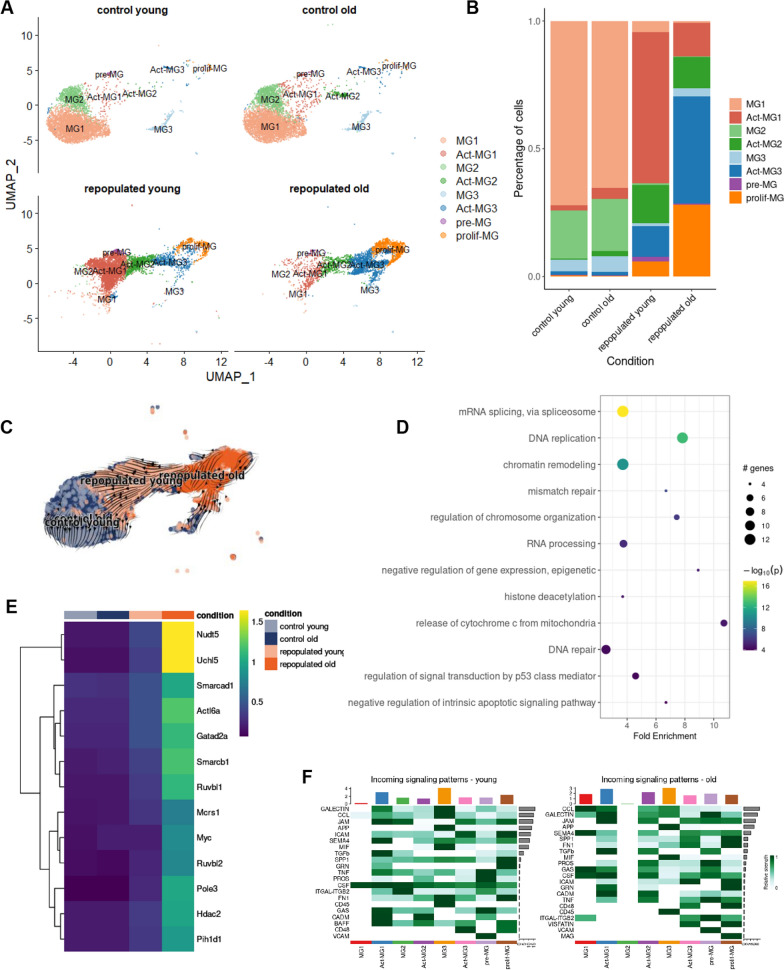
Fig. 3.
Dysfunctional microglial repopulation in aging mice. A UMAP plot of scRNA-seq data showing the clustering of control and repopulated MG from brains of young and aging mice. For each condition, four scRNA-seq replicates were combined. The cluster annotations as in the Fig. 2A. B Fraction of cells assigned into each cell cluster, separately for each of four conditions. C UMAP plot overlaid with RNA velocity vectors (as quantified by scVelo), demonstrating expression dynamics across experimental conditions. D Selected enriched KEGG pathways in the set of differentially expressed genes in the activated MG3 (Act-MG3) cluster compared to other cell clusters. E Heatmap of average expression of upregulated genes from the chromatin remodeling KEGG pathway and enriched in activated-MG3 cell cluster, divided by experimental conditions. F Communication probability via selected ligand-receptor pairs (y-axis) for each directed pair of cell clusters (x-axis)

