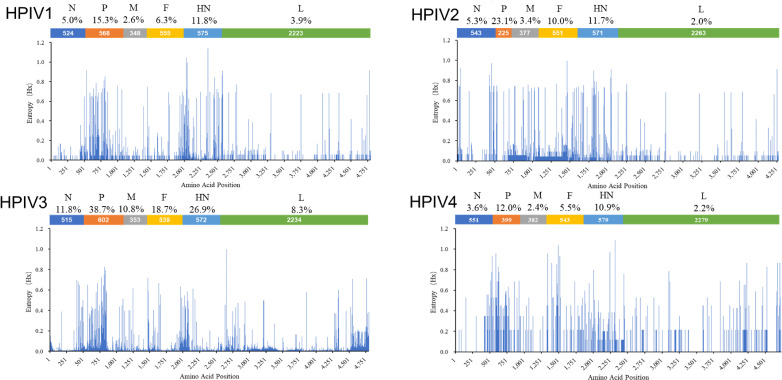
Fig 5.
Entropy plots of concatenated HPIV1 (A), HPIV2 (B), HPIV3 (C), and HPIV4b (D) protein sequences. For each amino acid position in the protein sequence, higher entropy values represent greater amino acid variation. Abbreviated protein sequence names are shown across the top of the plot in the order in which coding sequences are arranged in the genome. The percentage values show the percentage of positions in the protein that have a mutation present in more than one sequence.

