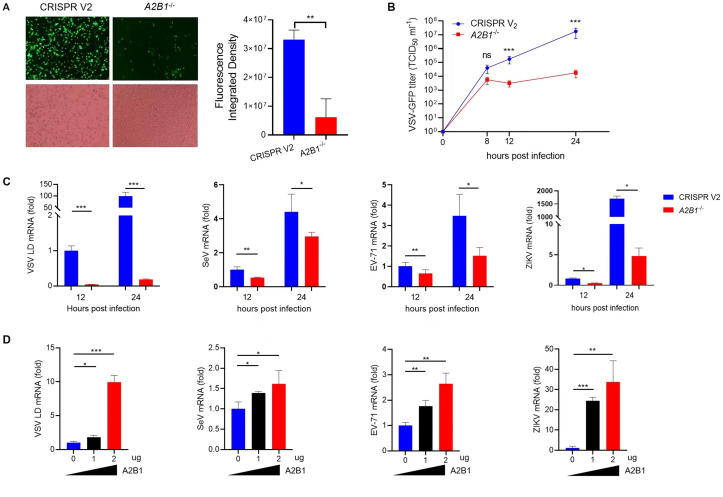
Fig 4.
HnRNP A2B1 upregulation of viral replication is conserved among RNA viruses. (A) WT and A2B1-/- THP-1 cells were infected with VSV-GFP at an MOI of 10 for 24 h. Green fluorescence was observed with a fluorescence microscope, and cells were observed with an inverted microscope (left). The relative fluorescence intensity was calculated using Image J software (light). (B) WT and A2B1-/- THP-1 cells were infected with VSV-GFP virus at an MOI of 10 for the indicated time points. VSV-GFP virus titers in cell culture supernatant were measured with TCID50. (C) WT and A2B1-/- THP-1 cells were infected at an MOI of 10 with VSV-GFP, SeV, EV71, or Zika for 12 h and 24 h, respectively. Viral mRNA levels were analyzed with RT-qPCR. (D) MEF cells were transfected with HA-tagged A2B1 for 24 h and then were infected at an MOI of 10 with VSV-GFP, SeV, EV71, or ZIKV for 12 h and 24 h, respectively. Viral mRNA levels were analyzed with RT-qPCR. Data were obtained from three independent experiments (n = 3). *P < 0.05, **P < 0.01, ***P < 0.001, ns, not significant.

