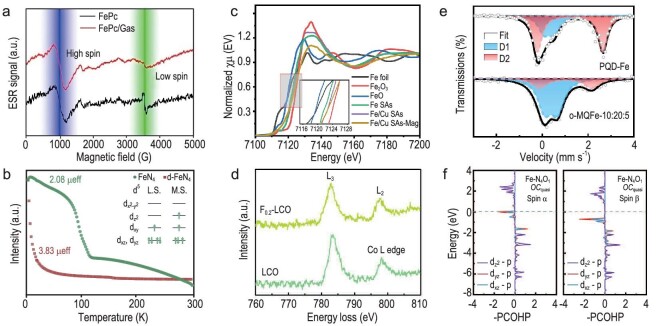
Figure 3.
(a) ESR spectra of FePc and FePc incorporated with GaS (FePc/GaS) recorded at 100 K. Blue and green areas identify the range of high- and low-spin signals, respectively. Reproduced with permission from Ref. [59]. Copyright 2022, Wiley-VCH GmbH. (b) Magnetic susceptibility calculated by M–T curve for d-FeN4 and FeN4. The upper right inset shows the occupation of d-orbital electrons in both samples. Reprinted with permission from Ref. [61]. (c) Fe K-edge XANES spectra of the Fe SAs, Fe/Cu SAs and Fe/Cu SAs-Mag. Reproduced with permission from Ref. [67]. Copyright 2023, Wiley-VCH GmbH. (d) The EELS spectrum of Co L-edge for LaCoO3 (LCO) and F-doped LaCoO3 (F0.2-LCO). Reprinted with permission from Ref. [69]. Copyright 2022, Wiley‐VCH GmbH. (e) 57Fe Mössbauer spectra of Fe-chelated polymer-like quantum dots (PQD-Fe) and O-terminated MXene nanosheet (o-MQFe). Reprinted with permission from Ref. [70]. Copyright 2022, Wiley-VCH GmbH. (f) The crystal orbital Hamilton populations (COHP) analysis derived from density of states (DOS) of Fe–O bond for Fe-N4 of Fe-N4O1 with quasi-octahedral coordination (Fe-N4O1 OCquasi) after *OH adsorption. Reprinted with permission from Ref. [71]. Copyright 2023, Wiley-VCH GmbH.

