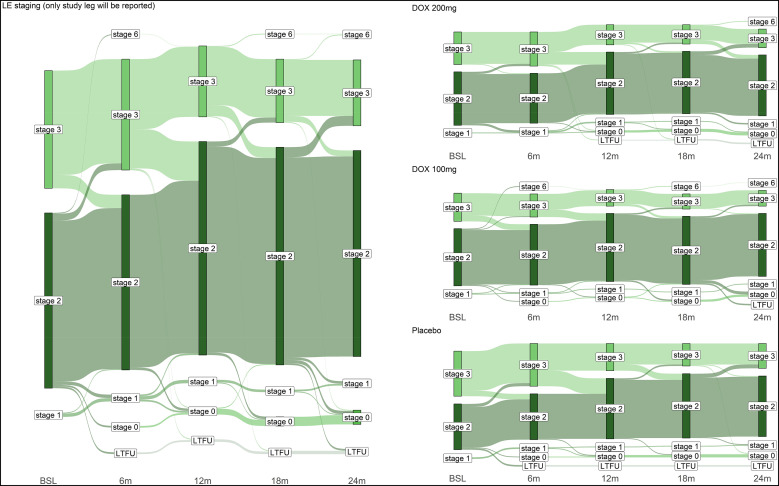
Figure 2.
Sankey diagram of stage changes over time. The Sankey diagram shows changes in the LE stages in the ITT collective over the study period of 2 years for all participants together (left graph) and divided by the three different treatments (right graph). BSL = baseline; DOX = doxycycline; ITT = intention-to-treat; LE = lymphedema; LTFU = lost-to-follow-up.

