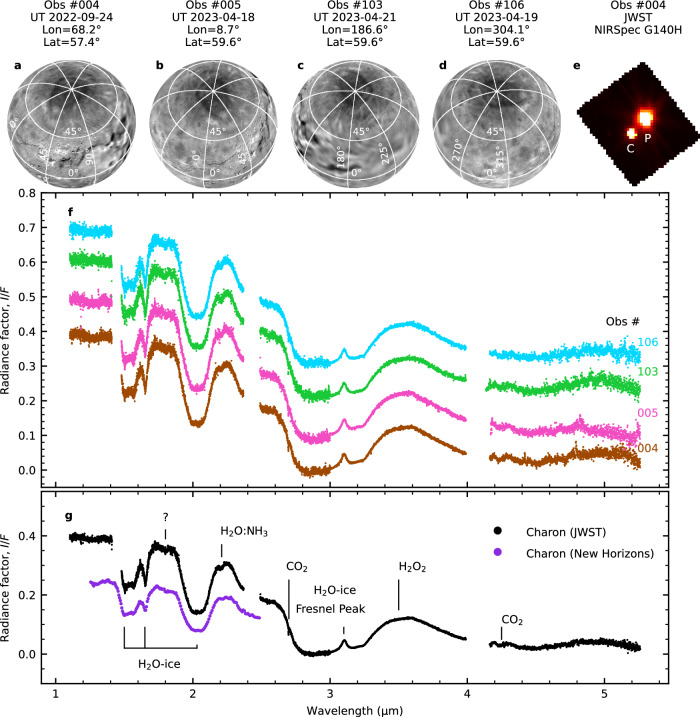
Fig. 1. JWST/NIRSpec IFU observations of Charon and detected ice species.
a–d Charon’s surface, as imaged by the New Horizons/LOng Range Reconnaissance Imager (LORRI) and Multi-spectral Visible Imaging Camera (MVIC) instruments81,82, is presented in orthographic projection, centered on the sub-observer longitude and latitude during the four JWST observations. e Image of Pluto (marked as “P”) and Charon (marked as “C”), generated by median-combining all slices within the wavelength range covered by the JWST/NIRSpec IFU G140H grating (observation #004). f The I/F spectra extracted from each observation, offset along the y-axis for clarity. Gaps observed in the extracted Charon spectra arise from a physical separation between the two NIRSpec detectors, NRS1 and NRS2, in the focal plane array. This impacts NIRSpec IFU observations using high-resolution gratings, as the spectra are broad enough to encompass both detectors. g The grand-average spectrum of Charon, obtained by averaging all four spectra. The compounds that account for the detected absorption bands in Charon’s spectrum are labeled in the figure. All four observations demonstrate consistent spectral shapes, displaying not only H2O ice absorption bands and the 2.2-μm feature attributed to NH3 diluted in H2O ice but also distinct evidence of the CO2 combination mode at 2.70 μm and the asymmetric stretching fundamental at 4.27 μm, as well as a plateau at 3.5 μm due to H2O2. Additionally, an absorption band centered around 1.8 μm is observed, though its nature remains uncertain. For comparison, the disk-averaged spectrum from New Horizons/LEISA's C_LEISA_HIRES scan of Charon8 is also shown (purple points). Source data are provided as a Source Data file.

