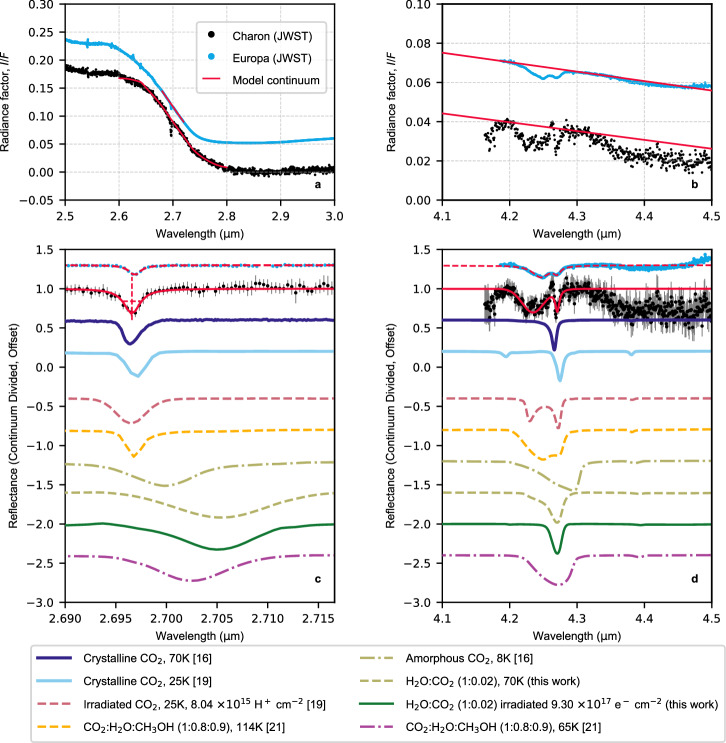
Fig. 2. The nature of carbon dioxide on the surface of Charon.
a, b The JWST spectrum of Charon, represented by black points, is displayed in two wavelength regions where the ν1 + ν3 and 2ν2 + ν3 (panel a) as well as the ν3 (panel b) CO2 absorption bands occur. For comparison, the JWST spectrum of Europa12 is shown (cyan points). The Europa spectrum is normalized to Charon’s I/F level at 2.52–2.54 μm (panel a) and 4.28–4.29 μm (panel b), and has been vertically shifted for better visualization. The red lines show the model of the local continuum around the CO2 bands under study (refer to the main text for detailed discussion). c, d Continuum-corrected spectra of Charon and Europa are shown together with their 1-σ errors. Both the dashed and solid red lines illustrate fits of the CO2 band profile, which utilizes a combination of Gaussian and Lorentzian profiles. For comparison, colored lines show various types of CO2 measured in the laboratory. Initially expressed in terms of absorbance (or optical depth), these measurements underwent conversion to reflectance, ensuring the preservation of the original sample thickness. Subsequent continuum correction was applied, followed by scaling to align with the observed band depth. These spectra, while vertically offset, serve as benchmarks for evaluating spectral shape and position. Source data are provided as a Source Data file.

