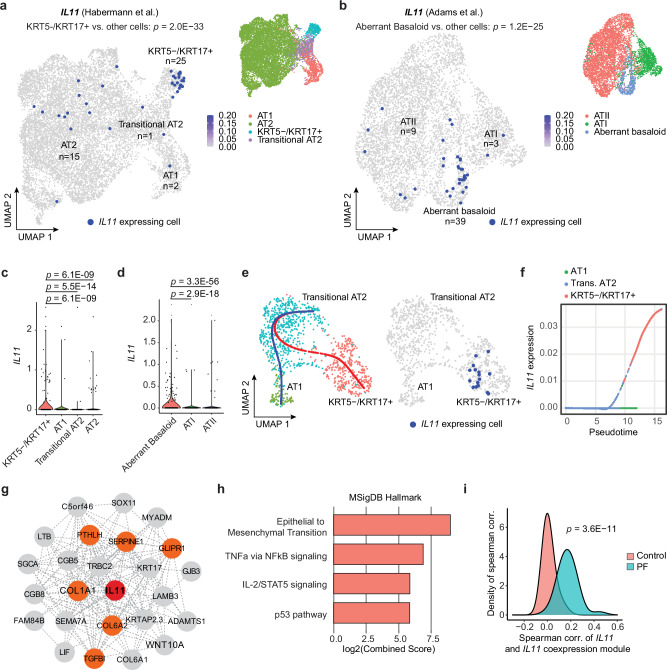
Fig. 1. IL11 is specifically expressed by aberrant KRT5-/KRT17+ epithelial cells in human pulmonary fibrosis.
Uniform manifold approximation and projection (UMAP) visualization of IL11 expressing single cells (colored in dark blue) in various alveolar epithelial cell populations (colored by cell types) in scRNA-seq data from Control and pulmonary fibrosis (PF) samples in a Habermann et al. (GSE135893) and b Adams et al. (GSE136831) datasets. The number of IL11-expressing cells in each cell cluster is indicated. P values determined by one-tailed hypergeometric test for enrichment in KRT5-/KRT17+ or aberrant basaloid versus other cell types. Violin plot indicating the expression of IL11 in various alveolar epithelial cell populations in c Habermann et al. dataset and d Adams et al. datasets. P values were determined by a two-tailed Mann–Whitney test between KRT5-/KRT17+ or aberrant basaloid versus other cell types. e UMAP visualization of IL11 expressing single cells colored in dark blue (right panel) and colored dots indicate cell type clustering (left panel). The blue line indicates the differentiation trajectory of transitional AT2 to AT1 cells; the red line indicates the differentiation trajectory from transitional AT2 to KRT5-/KRT17+. Data were composed of cells from PF samples in the Habermann et al. dataset. f Expression of IL11 in the pseudotime trajectory from transitional AT2 to KRT5-/KRT17+ versus from transitional AT2 to AT1 cells in the Habermann et al. dataset. g Network of genes in the IL11 co-expression module in the transitional AT2 to KRT5-/KRT17+ cell trajectory in combined Habermann et al. and Adams et al. datasets. IL11 is colored in red, and genes related to epithelial to mesenchymal transition are colored in orange. h Pathway enrichment of genes in the IL11 co-expression module using MSigDB Hallmark database. i Density plot displaying the distribution of Spearman correlation between the gene expression of IL11 and IL11 co-expression module in Control (salmon color) and PF (turquoise color) transitional AT2 and KRT5-/KRT17+ cells in Habermann dataset. P value was determined by the two-tailed Kolmogorov–Smirnov test.

