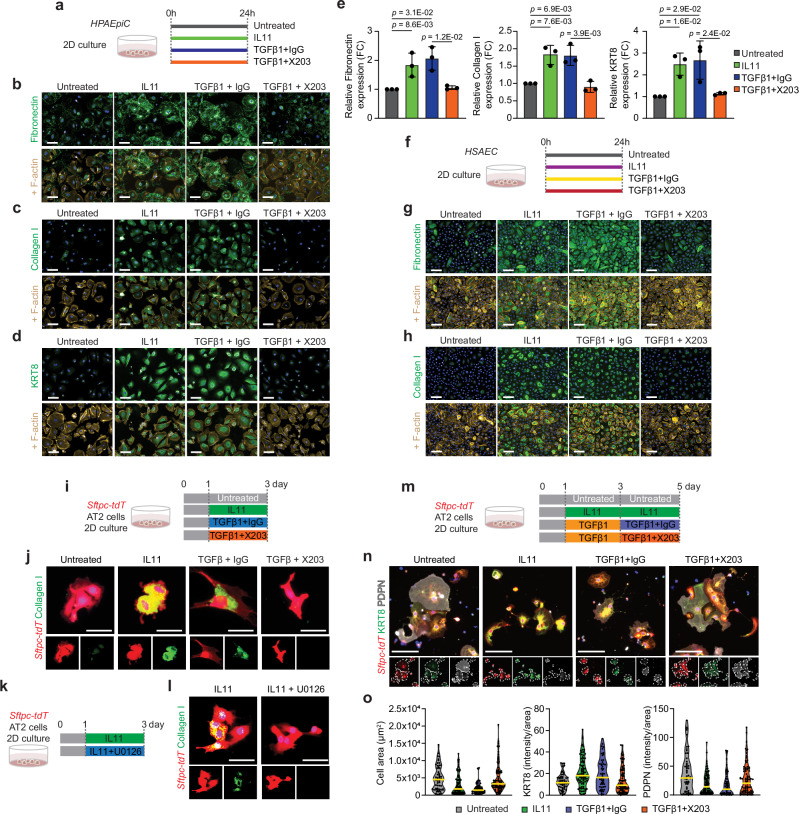
Fig. 3. IL11 induces KRT8 expression and profibrotic features in alveolar and distal airway epithelial cells and stalls AT2-to-AT1 cell differentiation in vitro.
a Experimental design for the 2D culture of primary human pulmonary alveolar epithelial cells (HPAEpiC) treated with IL11 (5 ng/ml) or TGFβ1 (5 ng/ml) in the presence of anti-IL11 (X203) or IgG control antibodies (2 µg/ml). b–e Immunostaining and quantification of Fibronectin, Collagen I or KRT8 expression in HPAEpiC. n = 3/group. FC fold change. f Experimental design for the 2D culture of primary human small airway epithelial cells (HSAEC) treated with IL11 (5 ng/ml) or TGFβ1 (5 ng/ml) with anti-IL11 (X203) or IgG control antibodies (2 µg/ml). g, h Immunostaining of Fibronectin or Collagen I expression in HSAEC. n = 2/group. Quantification data were shown in Supplementary Fig. 11c. i Experimental design and j immunostaining of Collagen I expression in Sftpc-tdT+ AT2 cells treated with IL11 (5 ng/ml), TGFβ1 (5 ng/ml), X203 or IgG control antibodies (2 µg/ml). k Experimental design and l immunostaining images of Collagen I in Sftpc-tdT+ AT2 cells treated with IL11 (5 ng/ml) and MEK inhibitor U1026 (10 µM). Quantification of Collagen I expression are shown in Supplementary Fig. 11g, h. m Experimental design for the in vitro differentiation of Sftpc-tdT+ AT2 cells to AT1 cells in the presence of IL11 (5 ng/ml), TGFβ1 (5 ng/ml), X203 or IgG control antibodies (2 µg/ml). n Immunostaining of KRT8 and PDPN in Sftpc-tdT+ cells at day 5. Individual cells are highlighted within dotted lines in split channels. o Violin plots of cell size and immunostaining quantification of KRT8 or PDPN expression in tdT+ cells at day 5; One representative dataset of two independent experiments are shown (n > 50 cells/group). Data were representative of three independent experiments in (b–d) or two independent experiments in (g, h, j, l, n). Scale bars: 100 µm (b–d, g, h), 25 µm (j, l), 50 µm (o). Data in (e) are mean ± s.d. and P values determined by one-way ANOVA with Tukey’s multiple comparison test.

