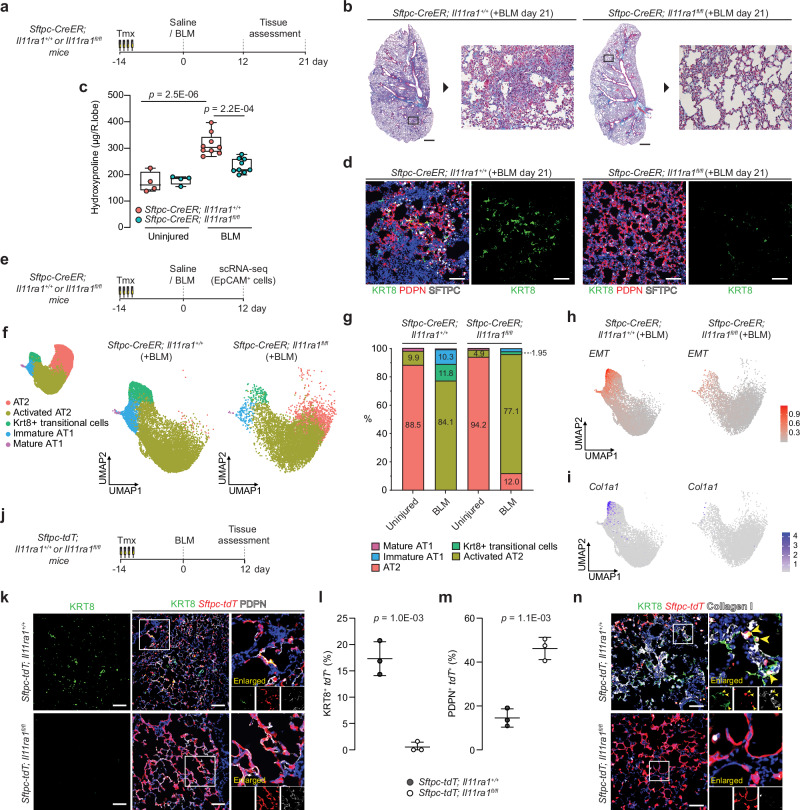
Fig. 4. IL11 signaling in AT2 cells disrupts AT2-to-AT1 differentiation after injury and is required for lung fibrosis.
a Schematic showing the induction of lung injury in Sftpc-CreER; Il11ra1fl/fl or Il11ra1+/+ mice via oropharyngeal injection of BLM and the time points of tissue assessment. b Representative images of Masson’s trichrome staining and c lung hydroxyproline content of right caudal lobes of Sftpc-CreER; Il11ra1fl/fl or Il11ra1+/+ mice 21 days post-BLM injury; n = 4 control and 9 injured mice/genotype. d Immunostaining of KRT8 and PDPN in the lungs of BLM-treated Sftpc-CreER; Il11ra1fl/fl or Il11ra1+/+ mice. e Schematic showing the induction of lung injury in Sftpc-CreER; Il11ra1fl/fl or Il11ra1+/+ mice and at day 12, lung single cells were enriched for EpCAM+ epithelial cells and assessed using scRNA-seq. f UMAP embedding of alveolar epithelial cells from scRNA-seq analysis showing distinct cell states and g distribution of alveolar epithelial cell states from Sftpc-CreER; Il11ra1fl/fl or Il11ra1+/+ mice 12 days post-BLM injury. h UMAP visualization of single cells colored by gene expression signature score for EMT pathway from the MSigDB Hallmark gene sets and i UMAP visualization of Col1a1 expressing single cells (purple dots) from AT2-lineage cells from Sftpc-CreER; Il11ra1fl/fl or Il11ra1+/+ mice post-BLM challenge. j Schematic showing the induction of lung injury in Sftpc-tdT; Il11ra1fl/fl or Il11ra1+/+ mice. Lung tissues were assessed 12 days post-BLM challenge. k Immunostaining of KRT8 and PDPN in the lungs of BLM-treated Sftpc-tdT; Il11ra1 fl/fl or Il11ra1+/+ mice and the proportion of l KRT8+ tdT+ or m PDPN+ tdT+ relative to total tdT+ cells, n = 3 mice/group. n Images of immunostaining for KRT8 and Collagen I in lungs from BLM-treated Sftpc-tdT; Il11ra1 fl/fl or Il11ra1+/+ mice. Data were representative of three independent experiments (d, n). Data were median ± IQR and whiskers represent minimum to maximum values (c) and mean ± s.d. (l, m). P values were determined by one-way ANOVA with Tukey’s multiple comparison test (c), two-tailed Student’s t-test (l, m). Scale bars: 1000 µm (b), 100 µm (d, k, n).

