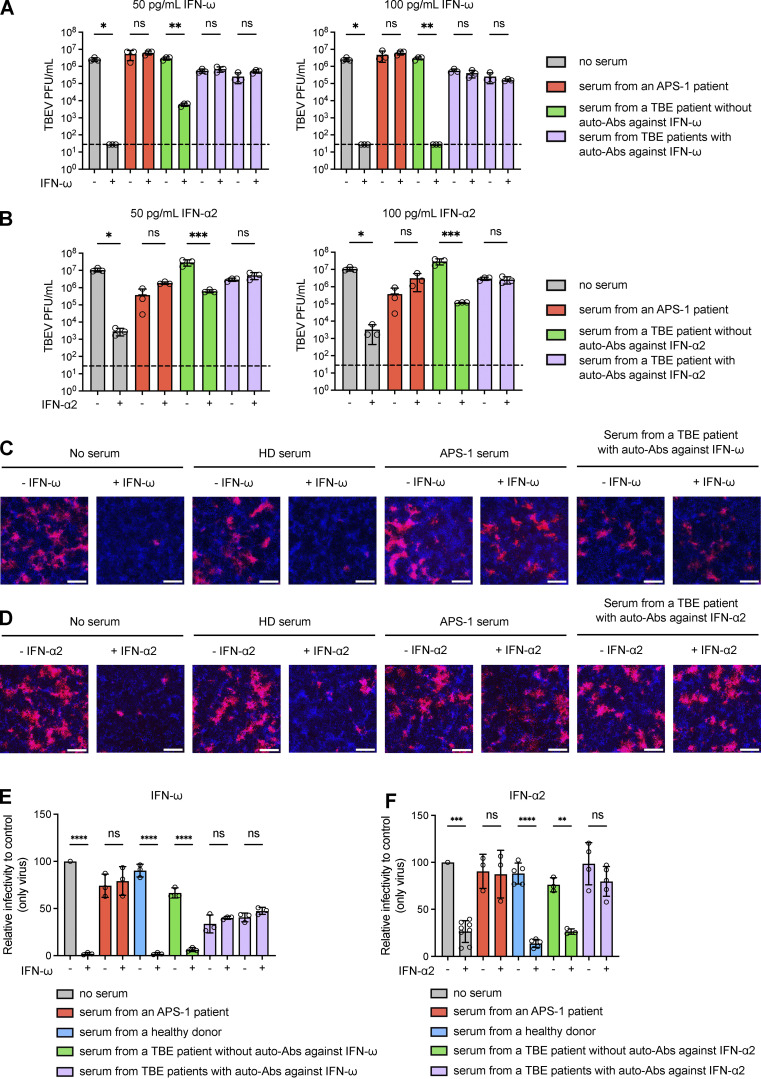
Figure 3.
TBEV infection and IFN treatment in Vero-E6 cells. (A and B) Plaque assay showing TBEV viral titers (PFU/ml) in Vero-E6 cells left untreated or treated with serum samples from patients with or without auto-Abs neutralizing IFN-ω in the presence of 50 pg/ml IFN-ω (A, left panel), 100 pg/ml IFN-ω (A, right panel), 50 pg/ml IFN-α2 (B, left panel), or 100 pg/ml IFN-α2 (B, right panel). For each set of serum conditions, we compared the values obtained in the presence and absence of IFN treatment in an ordinary one-way ANOVA with Bonferroni correction (as implemented in GraphPad Prism version 10.2.3). ns: non-significant; *: P < 0.05; **: P < 0.01; ***: P < 0.001. The dashed line indicates the limit of detection of the plaque assay. (C and D) Fluorescence microscopy images of Vero-E6 cells with and without treatment with 50 pg/ml IFN-ω (C) or 50 pg/ml IFN-α2 (D) in the absence of serum or the presence of serum from a healthy donor (HD), an APS-1 patient (with auto-Abs against IFN-ω and IFN-α2), a TBE patient with auto-Abs against IFN-ω (C) or a TBE patient with auto-Abs against IFN-α2 (D). Vero-E6 cells were then infected with mCherry-TBEV. The nuclei were stained with Hoechst stain before the measurement of fluorescence. The scale bars represent 300 µm. (E and F) Quantification of TBEV-positive Vero-E6 cells normalized against the percentage of cells infected in TBEV-only conditions, for different serum samples, with or without IFN-ω (E) or IFN-α2 (F) treatment. ns: non-significant; **: P < 0.01; ***: P < 0.001; ****: P < 0.0001. For each set of serum conditions, the values obtained in the presence and absence of IFN treatment were compared in an ordinary one-way ANOVA with Bonferroni correction (as implemented in GraphPad Prism version 10.2.3).

