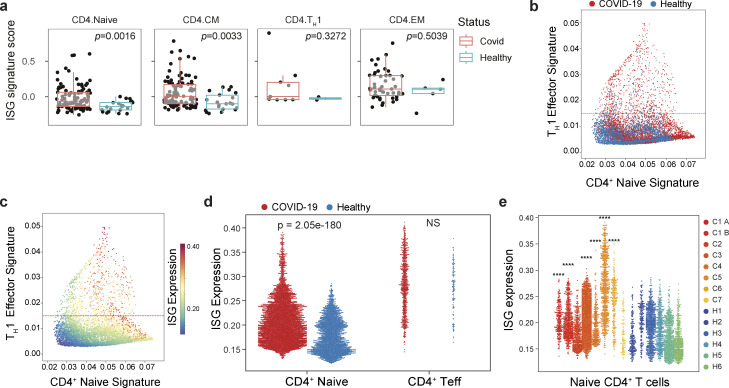
Figure 5.
Type I IFN signaling in naïve CD4+ T cells in COVID-19. (a) ISG expression in patients with acute severe COVID-19 (Stephenson et al., 2021). ISG signature scores were averaged within each subset for each sample, with only samples having >10 cells for a particular CD4+ subset (central memory [CM], effector memory [EM], naïve, TH1) being used. Differential ISG signature score values between COVID-19 and healthy samples were assessed by a two-sided Wilcoxon rank-sum test. (COVID-19, n = 101; healthy control, n = 21). (b–e) ISG expression (as in Fig. 4 b) in patients with acute severe COVID-19 (Wilk et al., 2020). (b and c) Scatter plot of peripheral blood CD4+ T cell transcriptomes from healthy donors (H1–H6) or patients with acute severe COVID-19 (C1–C7). Each dot represents a cell, plotted by mean expression of the top 50 signature naïve T cell (x-axis) and TH1 effector genes, 6 days after viral infection (y-axis) and overlaid with disease status (b) or ISG signature expression (c). Cells above the dashed line representing the 10th percentile are considered effector T cells; cells below are considered naïve. (d) Naïve CD4+ T cell signature ISG genes (as in Fig. 4 b) are expressed higher amongst naïve CD4+ T cells, defined in Fig. 5 c, in patients with COVID-19 compared with healthy controls. (e) ISG signature gene expression in naïve CD4+ T cells for each individual patient and healthy control. Statistical significance by nonparametric Mann–Whitney U test between total COVID and total healthy populations (d), and between the individual COVID patient and total healthy populations (e); ****P < 0.0001.

