Figure S2.
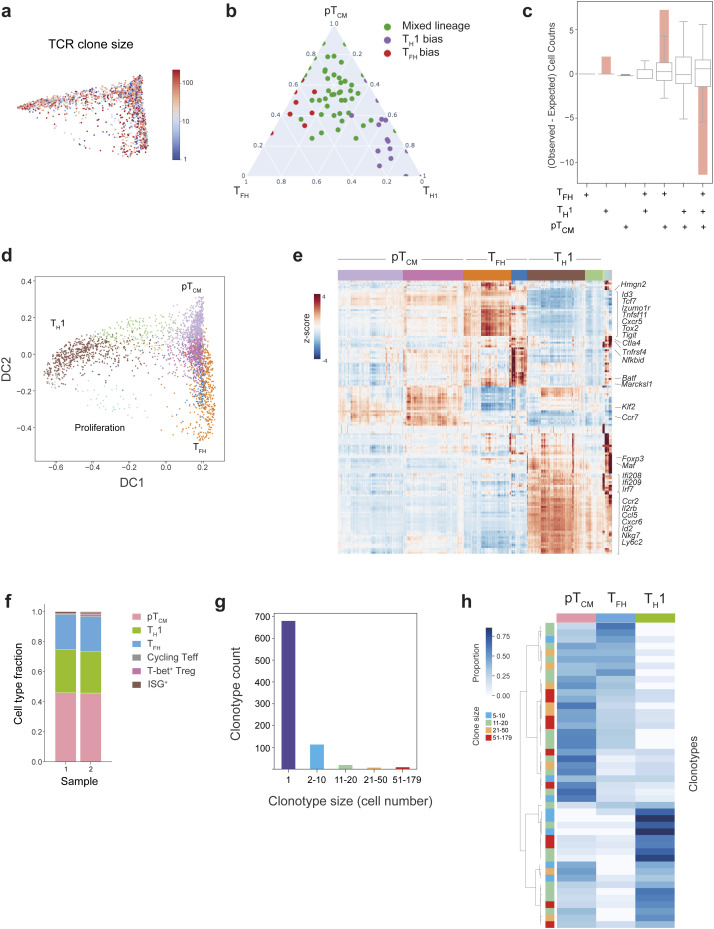
Paired TCR and transcriptomic analysis of antigen-specific CD4+ T cell responses to L.m. Related to Fig. 2. (a) Diffusion map of gp66:I-Ab+ CD4+ T cells colored by clone size, showing a similar degree of clonal expansion across TH cell subsets. (b) Clonotypes ≥5 cells were clustered on the basis of their phenotypic distribution using Phenograph. Three distinct phenotypic patterns were identified: TH1 bias, TFH bias, or mixed lineage phenotypes. Ternary plot showing the proportion of TH1, TFH, or pTCM cells for each clonotype. Each dot represents an individual clonotype, colored by its phenotype. (c) Bar graph showing the overrepresentation or underrepresentation (observed–expected counts) of clonotype frequency for each combination of TFH, TH1, and TCM phenotypes with respect to randomized permutations. Box plots indicate the expected clonotype frequencies for each phenotype combination if clones were randomly distributed. The solid pink bars represent the deviation of the observed clonotype frequency for each phenotype combination from the randomized expectation. (d) Diffusion map visualization of single cell transcriptomes from replicate gp66:I-Ab+ CD4+ T cells, colored by their Phenograph cluster identity, illustrating three distinct cell fates: TH1, TFH, and pTCM. (e) Heatmap showing MAGIC imputed, log-normalized expression of top 20 DEGs (log2FC > 0.5, FDR < 0.01), for each Phenograph cluster shown in d. The colored bar at the top of the heatmap shows the assignment of cells to these clusters. (f) Fraction of cells within each effector CD4+ T cell lineage for replicate samples. Equivalent proportions of TH1, TFH, and pTCM cells were observed in two independent experiments. (g) Graph showing frequency and size distribution of clonotypes amongst replicate gp66:I-Ab+ CD4+ T cells. (h) Heatmap demonstrating the proportion of cells within a given clonotype with a TH1, TFH, or pTCM phenotype, for clonotypes ≥5 cells for the replicate gp66:I-Ab+ CD4+ T cell sample. Each row represents an individual clonotype. The color bar on the left indicates clone size. Clonotypes are ordered by hierarchical clustering with complete linkage and correlation distance.

