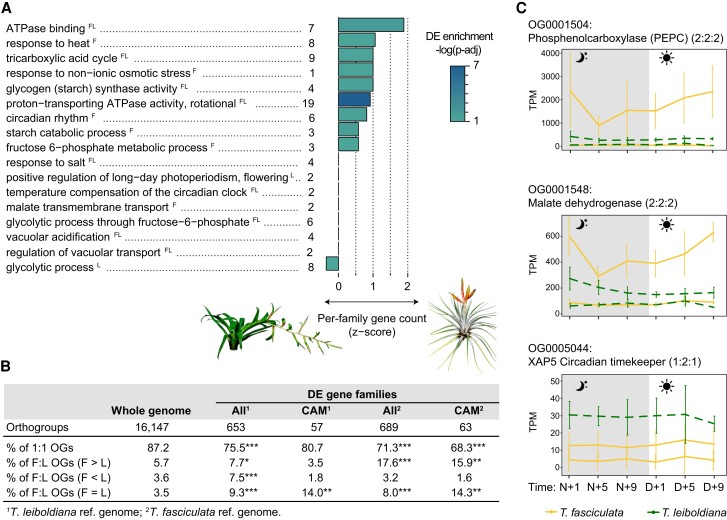
Figure 5.
Enrichment and expression curves of multicopy orthogroups among orthogroups with timewise differentially expressed genes between T. fasciculata and T. leiboldiana. Timewise differentially expressed genes between species were obtained by sampling 6 genotypes per species across 6 time points over a 24-h cycle. RNA-seq reads were mapped to the genomes of both species and 2 separate analyses of differential gene expression were performed in maSigPro. For more information, see Materials and methods, Differential gene expression analysis, and Supplementary SI Note S9. A) CAM-related enriched GO terms among differentially expressed (DE) genes between T. fasciculata and T. leiboldiana. The letters F and L indicate whether a GO term was found enriched in the DE analysis using the T. fasciculata or T. leiboldiana genome assembly as reference genome, respectively. The family size difference for the underlying orthogroups is represented as a z-score: a negative score indicates a tendency toward gene families with larger size in T. leiboldiana than in T. fasciculata, and vice versa. The P-value displayed represents the significance of the GO-term enrichment among DE genes in the analysis using the T. fasciculata assembly as reference unless the term was only enriched in the analysis with the T. leiboldiana assembly as reference. The number of DE genes underlying each function is shown next to the GO-term name. The color gradient of the bars represents the adjusted P-value of the enrichment test on a logarithmic scale. B) Composition of orthogroups by relative size between T. fasciculata and T. leiboldiana for 3 orthogroup subsets (whole genome (i.e. all orthogroups), DE orthogroups, and CAM-related DE orthogroups). Species-specific orthogroups are not included in this analysis. F and L stand for the number of genes assigned to a specific orthogroup in T. fasciculata and T. leiboldiana, respectively, i.e. F > L indicates orthogroups with a higher gene count in T. fasciculata than in T. leiboldiana. A chi-square test of independence was applied to test the significance of composition changes in 2 × 2 contingency tables for each category when testing the entire DE orthogroup subset against non-DE orthogroups. For CAM-DE orthogroups, the Fisher's exact test was applied. Significant P-values of both tests are reported as: *0.05–0.01, **0.01–0.0001, ***0.0001–0. Exact P-values and other details on the statistical testing can be found in Supplementary Data Set 2. C) Expression profiles in a 24-h period of exemplary CAM-related gene families (phosphoenolpyruvate carboxylase [PEPC], malate dehydrogenase [MDH], and XAP5 CIRCADIAN TIMEKEEPER [XCT]) displayed at the orthogroup level. The number of genes assigned to each orthogroup is displayed in brackets next to the orthogroup name for (A. comosus: T. fasciculata: T. leiboldiana), respectively. For each gene copy and time point, the average read count (in transcripts per million, TPM), and the standard deviation across accessions are displayed. Read counts of each ortholog are obtained by mapping conspecific accessions to their conspecific reference genome. We show 2 families with older duplications preceding the split of T. fasciculata and T. leiboldiana (PEPC and MDH) and 1 gene family with a recent duplication in T. fasciculata (XCT).

