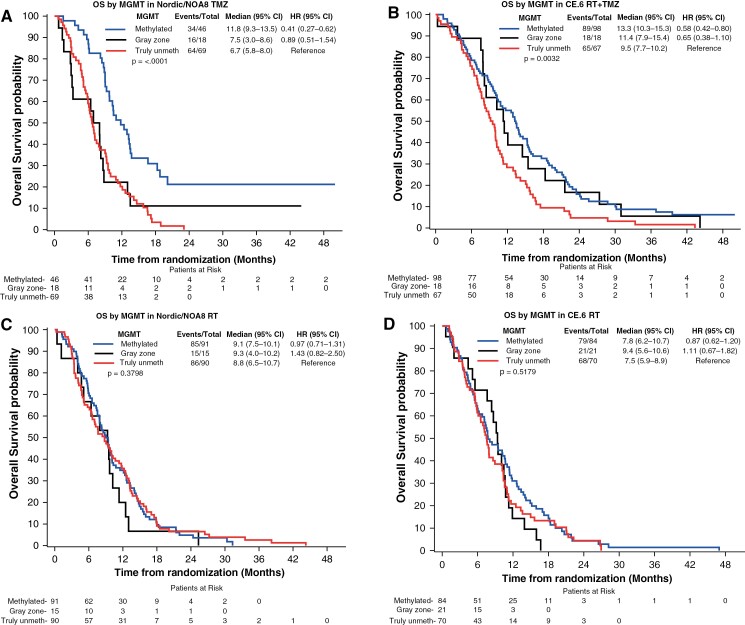
Figure 2.
MGMTp methylation and OS based on cutoff and safety margin. The association of MGMTp methylation with OS in the trial populations, separated into MGMTp methylated (> 1.27), gray zone (−0.28 and 1.27), and truly MGMTp unmethylated patients (<−0.28) as indicated, stratified by treatment and illustrated in Kaplan–Meier plots. A significant difference was observed among the subgroups in the TMZ arms of the pooled Nordic/NOA8 trial (A,P < .0001) and the CE.6 trial (B,P = .0032), respectively (log-rank tests comparing all 3 curves). No differences were observed in the corresponding RT arms (C, D). Pairwise log-rank tests for results with significant OS differences are as follows: (A) Nordic/NOA8 TMZ: methylated versus gray zone, P = .005; methylated versus truly unmethylated, P < .001, gray zone versus truly unmethylated, P = .647. (B) CE.6 RT + TMZ: methylated versus gray zone, P = .618; methylated versus truly unmethylated P = .001; gray zone versus truly unmethylated, P = .096.

