Figure 2.
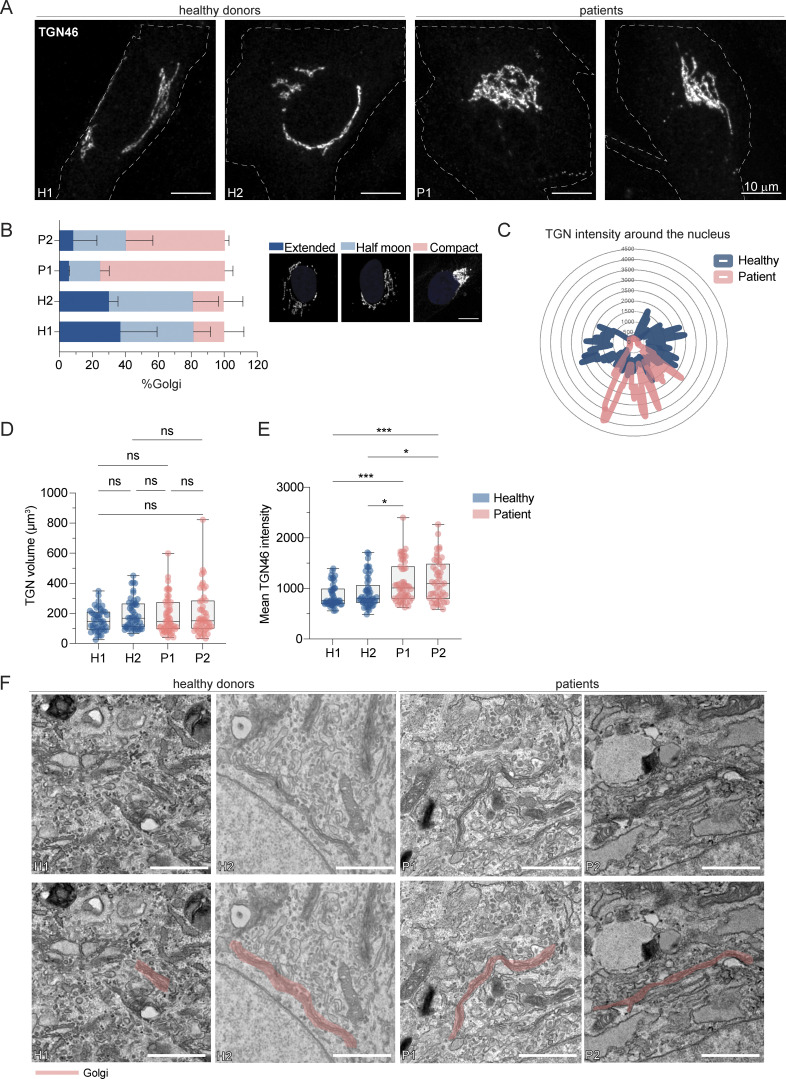
LRBA deficiency promotes TGN compaction in patient-derived cells. (A) TGN morphology analysis of two HDs and two patient-derived fibroblast lines visualized by the immunostaining of TGN46. Patient-derived cells show compacted TGN morphology. Representative confocal images from n = 3 biological replicates. Cell outlines are marked with a dashed line. H1: HD 1, H2: HD 2, P1: patient 1, P2: patient 2. (B) Measurements of TGN morphology (extended–dark blue, half moon–light blue, compact-pink) based on images taken in (A). Percentage of cells belonging to each category and standard deviation are shown; H1 = 47 cells, H2 = 47 cells, P1 = 53 cells, P2 = 49 cells from n = 3 biological replicates. The legend shows a representative image for each morphology category. (C) Representative TGN46 signal distribution around the nucleus in H1 and P1 cells. (D and E) Quantification of (D) TGN volume and (E) mean TGN46 intensity based on images taken in A. Mean and minimum to maximum are shown, the box ranges from the first (Q1–25th percentiles) to the third quartile (Q3–75th percentiles) of the distribution. All data points are shown.; H1 = 46 cells, H2 = 49 cells, P1 = 51 cells, P2 = 47 cells from n = 3 biological replicates; Kruskal–Wallis test using Dunn’s multiple comparison, ***P = 0.0007 (H1 versus P1), ***P = 0.0005 (H1 versus P2), *P = 0.0248 (H2 versus P1), *P = 0.0170 (H2 versus P2). (F) TEM images of two HDs and two patient-derived fibroblasts show intact Golgi cisternae. In the lower row, pink masks highlight Golgi stacks. Scale bar, 1 µm.

