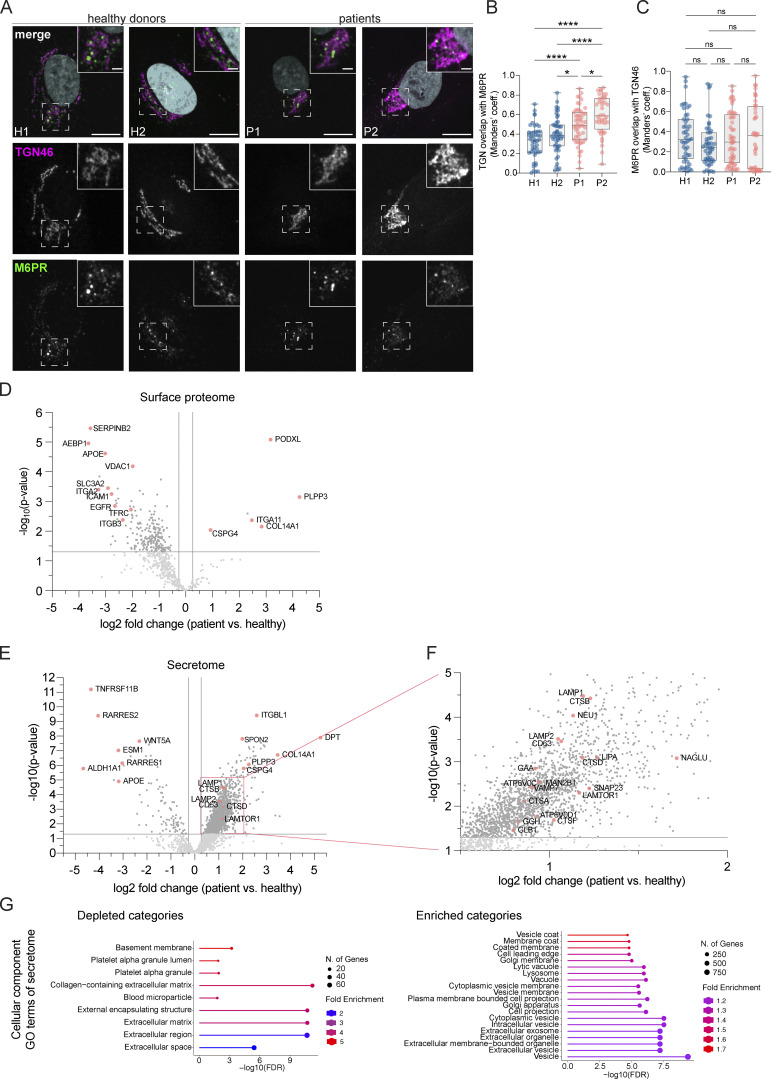
Figure 3.
Golgi-endosome traffic and secretion are only slightly altered in LRBA deficiency. (A) Colocalization analysis of TGN46 and M6PR in two HDs and two patient-derived fibroblast lines. Representative confocal immunofluorescence images of single focal planes. Squares show the magnified area. Inlays are shown in the top right corner of the images. The labeling of the single channels represents the color of the channel on the merged image. Scale bar, 10 μm, inlays 2 μm. (B and C) Colocalization between TGN46 and M6PR was measured using Mander’s colocalization index. Mean and minimum to maximum are shown, box ranges from the first (Q1–25th percentiles) to the third quartile (Q3–75th percentiles) of the distribution. H1 = 47 cells, H2 = 47 cells, P1 = 52 cells, P2 = 40 cells from n = 3 biological replicates. (B) Mander’s coefficient of TGN46 overlap with M6PR. One-way ANOVA using Tukey’s multiple comparison, ****P < 0.0001, *P = 0.0432 (H2 versus P1), *P = 0.0324 (P1 versus P2). (C) Mander’s coefficient of M6PR overlap with TGN46, Kruskal–Wallis test using Dunn’s multiple comparison. (D) Scatter plot of LRBA deficient versus healthy donor fibroblasts’ protein abundances in the cell surface proteome determined with cell surface biotinylation and LC-MS analysis. Datapoints above P value scores of 0.05 are indicated in light grey. Highlighted, significantly altered proteins (P < 0.05) are indicated in pink colors. (E) Volcano plot of patient/healthy donor protein abudances in the secretome determined by LC-MS analysis. (F) Inlay of volcano plot shown in panel E. (G) Gene ontology analysis of enriched and depleted cellular component categories in the patients’ secretome.

