Figure 4.
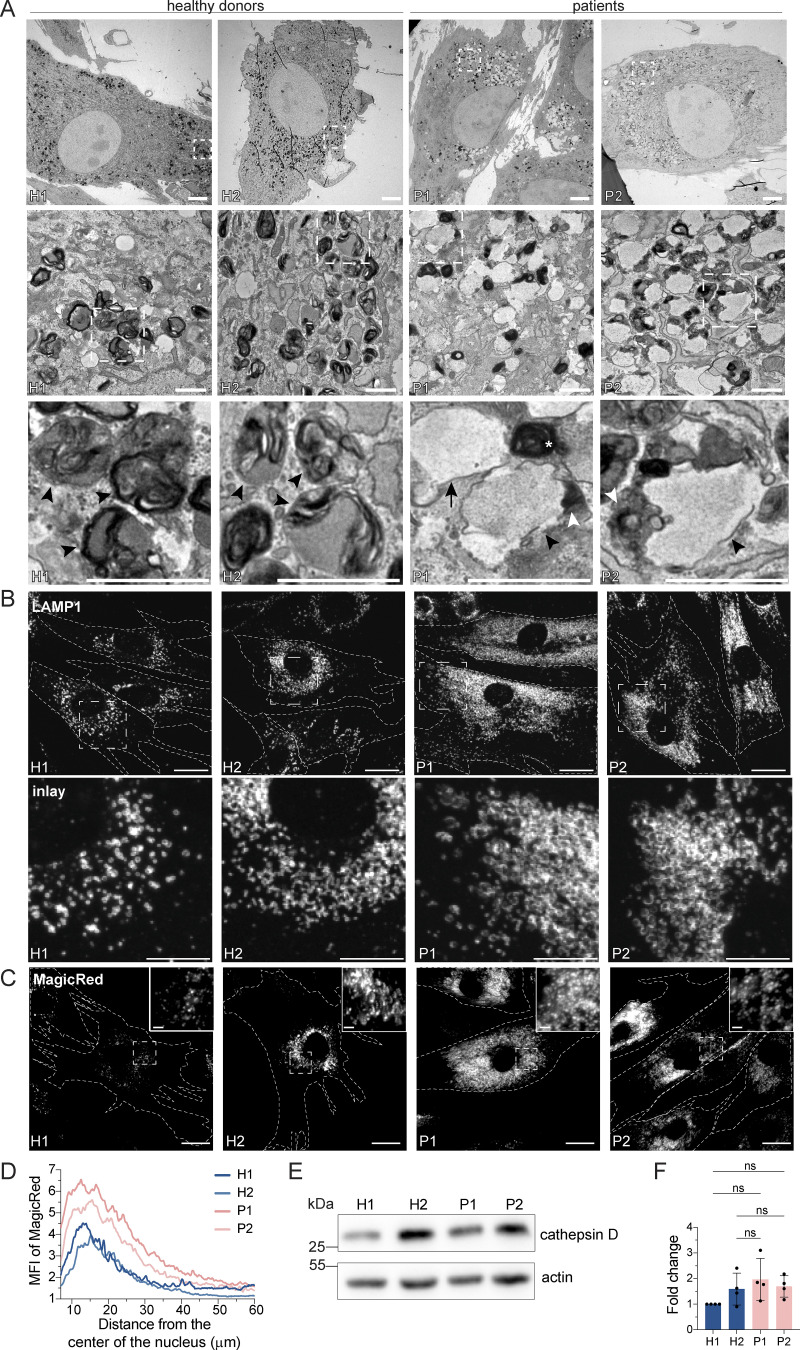
LRBA-deficient fibroblasts accumulate enlarged endolysosomes. (A) TEM analysis of accumulating endolysosomes in patient-derived cells. Squares show magnification of the endolysosomal structures. HDs showed electron-dense endolysosomes (black arrowheads). In contrast, in patient-derived cells, endolysosomes (black arrowheads) showed restricted degradative (electron-dense) domains (white arrowheads). Lysosomes (white star) and endosomes (black arrow) are shown. Two HDs and two patient-derived fibroblast lines were embedded and analyzed. Scale bar, 5 μm, inlays in the third row 1 μm. (B) Immunofluorescence analysis of accumulating, enlarged (endo)lysosomes in patient-derived cells. Fibroblasts were fixed with methanol and stained for LAMP1. Cell outlines are marked with a dashed line. Squares show magnification of the (endo)lysosomes. Representative confocal images are shown from n = 3 biological replicates. Scale bar, 20 μm, inlays 10 μm. (C) Analysis of cathepsin B activity in LRBA-deficient fibroblasts. LRBA-deficient patient-derived and healthy fibroblasts were plated onto imaging chambers and their lysosomes were visualized with Magic Red (indicating cathepsin B activity) and imaged live at 37°C, 5% CO2. Representative wide-field images are shown from n = 3 biological replicates. Cell outlines are marked with a dashed line. Squares show the magnified area. Inlays are shown in the top right corner of the images. Scale bar, 20 μm, inlays 2 μm. (D) Quantification of the MagicRed intensity along the nucleus-cell periphery axis. A line ROI was drawn from the nucleus to the cell periphery and Magic Red intensity was measured. Values were normalized to the maximum of each cell and averaged per experiment. The mean of three biological replicates is plotted along the axis; H1 = 45 cells, H2 = 53 cells, P1 = 51 cells, P2 = 49 cells were analyzed. (E) Western blot analysis of matured cathepsin D (heavy chain) protein levels in healthy and patient-derived fibroblasts using actin as a loading control. (F) Quantification of cathepsin D levels based on immunoblots shown on panel E from n = 4 biological replicates mean ± SD; one-way ANOVA using Tukey’s multiple comparison. Source data are available for this figure: SourceData F4.

