Figure 5.
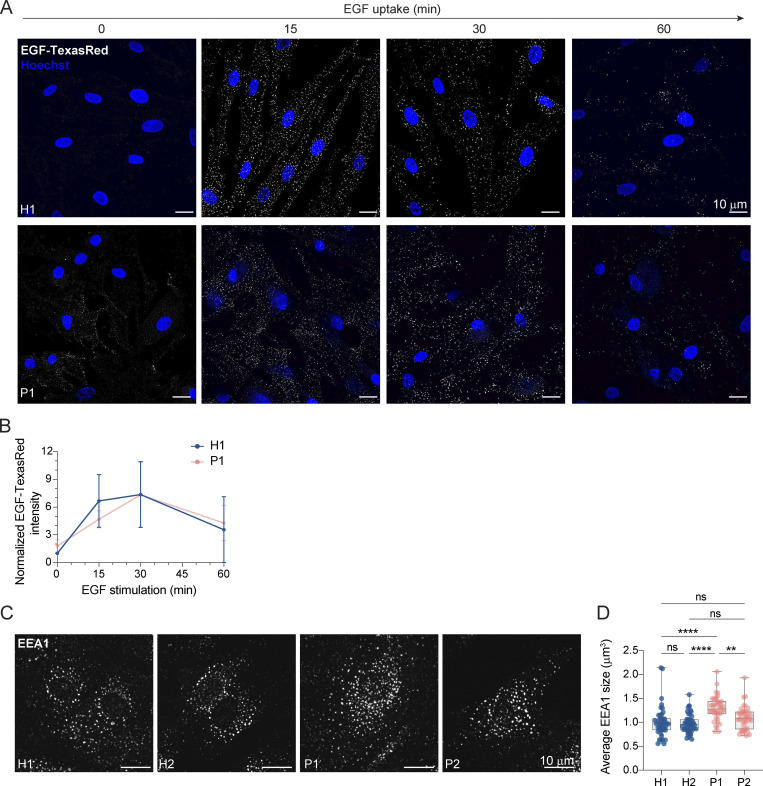
Lysosomal degradation is unimpaired in LRBA deficiency. (A) EGF-TexasRed uptake and degradation assay show unimpaired degradation in LRBA deficiency. H1 and P1 fibroblasts were serum-starved for 3 h and then were incubated on ice with EGF-TexasRed for 30 min. Cells were then washed 3× with ice-cold PBS and incubated with unlabeled EGF for indicated time points at 37°C. Cells were rinsed with ice-cold PBS, fixed with 4% PFA, and mounted in the presence of Hoechst dye to visualize nuclei. Overview confocal images of EGF-TexasRed signal are shown for each time point. Background signal has been subtracted using Gaussian blurring and image subtraction in Fiji. Maximum intensity projection of confocal Z-stacks. (B) Measurement of EGF-TexasRed fluorescence intensity based on images shown in A. Integrated density of EGF-TexasRed per cell was measured, averaged and normalized to H1 levels at 0 time point for each experiment; H1(0 min) = 38 cells, H1(15 min) = 58 cells, H1(30 min) = 67 cells, H1(60 min) = 44 cells, P1(0 min) = 36 cells, P1(15 min) = 51 cells, P1(30 min) = 45 cells, P1(60 min) = 50 cells were analyzed from n = 3 biological replicates. Mean and SD is shown. (C) Immunofluorescence analysis of EEA1-positive early endosomes in healthy and LRBA-deficient patient-derived fibroblasts. Maximum intensity projection of confocal Z-stacks. (D) Measurement of the average size of early endosomes per cell was measured. Mean and minimum to maximum are shown, box ranges from the first (Q1–25th percentiles) to the third quartile (Q3–75th percentiles) of the distribution. All data points are shown. H1 = 43 cells, H2 = 44 cells, P1 = 40 cells, P2 = 40 cells were analyzed from n = 3 independent experiments; Kruskal–Wallis test using Dunn’s multiple comparison. ****P < 0.0001, **P = 0.0093.

